Pink Lady apples - Improved colour, size, firmness and uniform maturity in the Goulburn Valley, 2020
Pre-harvest sprays of SUNRED and FOLICIST significantly improved premium yield of Pink Lady apples
Richard Hall, 7 May 2020
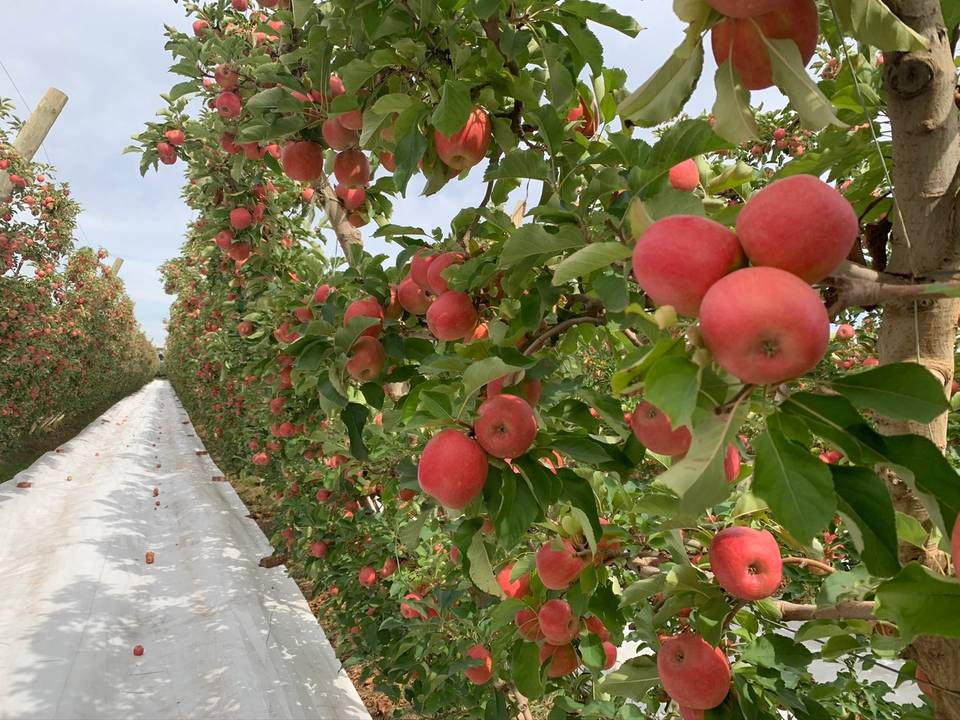
Pink Lady cv Rosy Glow apples in the Goulburn Valley ready for harvest April 2020
Crops
Variety
Pink Lady® cv Rosy Glow, Ruby Pink, Cripps Pink
Location
Goulburn Valley, Victoria, Australia
Study date
March - May 2020
Source
2020-03-AP-PL-GV-01_07
Sample
3 orchards, 7 blocks, 1,200 apples, 3,920 images, 34.3 million pixels
Products
Objectives
- Fruit size uniformity
- Improve fruit colour
- Increase premium yield
- Less soft fruit
Timings
- Pre-harvest
Summary
- +18% red colour (a* mode)
- +5.5g apple weight (for apples <200g)
- -50% less soft fruit (<8 kg/11mm)
- +20% premium maturity (density) fruit yield
Two pre-harvest sprays of SUNRED and FOLICIST significantly improved colour (p<0.001), weight (p<0.001), firmness (p=0.009), uniform maturity and premium yield of Pink Lady cv Rosy Glow, Ruby Pink and Cripps Pink apples.
This case study combines results from 3 orchards, 7 blocks in the Goulburn Valley, during commercial harvest 7 April through 7 May 2020.
In addition to significantly increased red apple colour, there was significantly less orange (colour oxidation) in apples from the sun exposed western side of SUNRED and FOLICIST Treated trees.
Pre-harvest SUNRED and FOLICIST sprays are a valuable precision ripening tool.
With precision ripening comes significant yield gains in premium fruit - colour, size, firmness and uniform maturity.
It is recommended to include 2 pre-harvest sprays of a SUNRED and FOLICIST tank-mix per the Apple & Pear Program.
For more information, to discuss specific blocks or place an order, contact Richard Hall 0413 182 763.
Introduction
Individual pieces of fruit mature and ripen at different rates, known as ripening kinetics.
Pro-actively managing ripening kinetics - precision ripening - is key to optimal fruit colour, size, firmness and uniform maturity.
Merely "waiting" for fruit to colour is to forego optimal colour, quality and premium yield. Fruit colour doesn't catch-up with time, rather, it oxidises as the fruit over matures.
Trees naturally adjust the ripening kinetics of individual pieces of fruit, working to ripen fruit as uniformly as possible in time for harvest.
We know this from walking into the orchard when fruit is beginning to colour, noting the very large variability in fruit maturity at this stage. Later when we come to harvest, that variability is naturally much less.
We can further reduce natural variability, improve fruit colour, size uniformity and quality by including key biological inputs in our ripening program.
Phenylalanine is the fuel that drives colour.
Phenylalanine is one of the key components of SUNRED along with methionine, oxylipins, monosaccharides and other plant extracts. These are natural enhances of many ripening related processes.
Fruit colour is an immune response.
Trees with higher levels of immune function produce apples with more colour and more uniform fruit maturity. Oxylipins are central to this immune response and key to biological precision ripening.
Oxylipins are biological signalling compounds with many physiological purposes, including promoting fruit colour and regulating fruit ripening kinetics.
The effects of oxylipins are context dependent. Oxylipins in under mature fruit increase ethylene biosynthesis and ripening. Oxylipins in over mature fruit decrease ethylene biosynthesis and ripening. Biological precision ripening gives us fine grain control of ripening kinetics at the individual fruit level.
FOLICIST reduces plant stress and is a powerful anti-oxidant amongst other things, hence including it with SUNRED to maximise colour and uniform ripening.
SUNRED and FOLICIST is applied pre-harvest for biological precision ripening. Precision ripening results in improved colour, fruit size uniformity, quality and premium yield.
Materials and Methods
Trial design and treatments
Trial design was determined and implemented by the various growers.
These were commercial applications of SUNRED and FOLICIST covering the majority of the blocks.
These results are from 3 orchards, 7 blocks in the Goulburn Valley, harvested between 7 April to 7 May 2020.
Growers themselves decided to leave certain rows unsprayed in each block.
Standard - March and April 2020
Timing
Pre-harvest
Foliar
Grower standard practices:
Various PGRs at various rates and timings
Plus or minus reflective cloth or foil in midrow
Plus or minus leaf blowing
Sampling
Table 1 in Statistics and appendices section summarises sampling by block.
Apple weight, size and firmness measurements
Weight of 1,200 apples (across 3 orchards, 7 blocks) was measured with laboratory scales.
Firmness of 720 apples (across 4 blocks) was measured with a penetrometer with 11 mm tip.
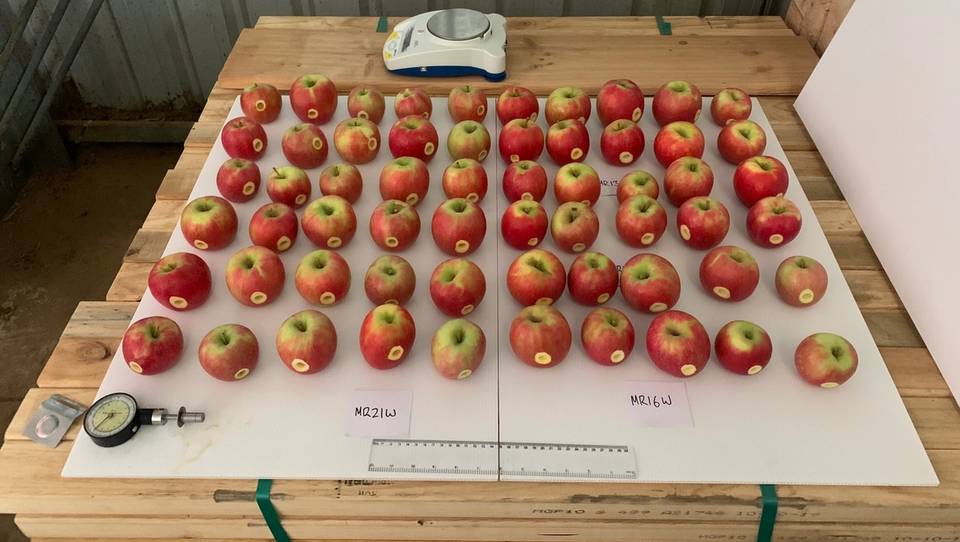
Photo 1 A sample of Rosy Glow apples with the penetrometer (11mm tip) and a set of laboratory scales used to measure fruit firmness and weight.
Apple size and colour of 1,080 apples (across 3 orchards, 6 blocks) was measured with AgIntelligent® Imaging.
Apple colour measurements
We use the AgIntelligent® Imaging system to quantitatively measure apple colour.
Colour measurements of 1,080 apples (across 3 orchards, 6 blocks) which included 3,920 apple images; top, exposed side, shaded side and bottom aspects.
In total, 34.3 million pixels were individually measured for colour characteristics, including quantifying red colour.
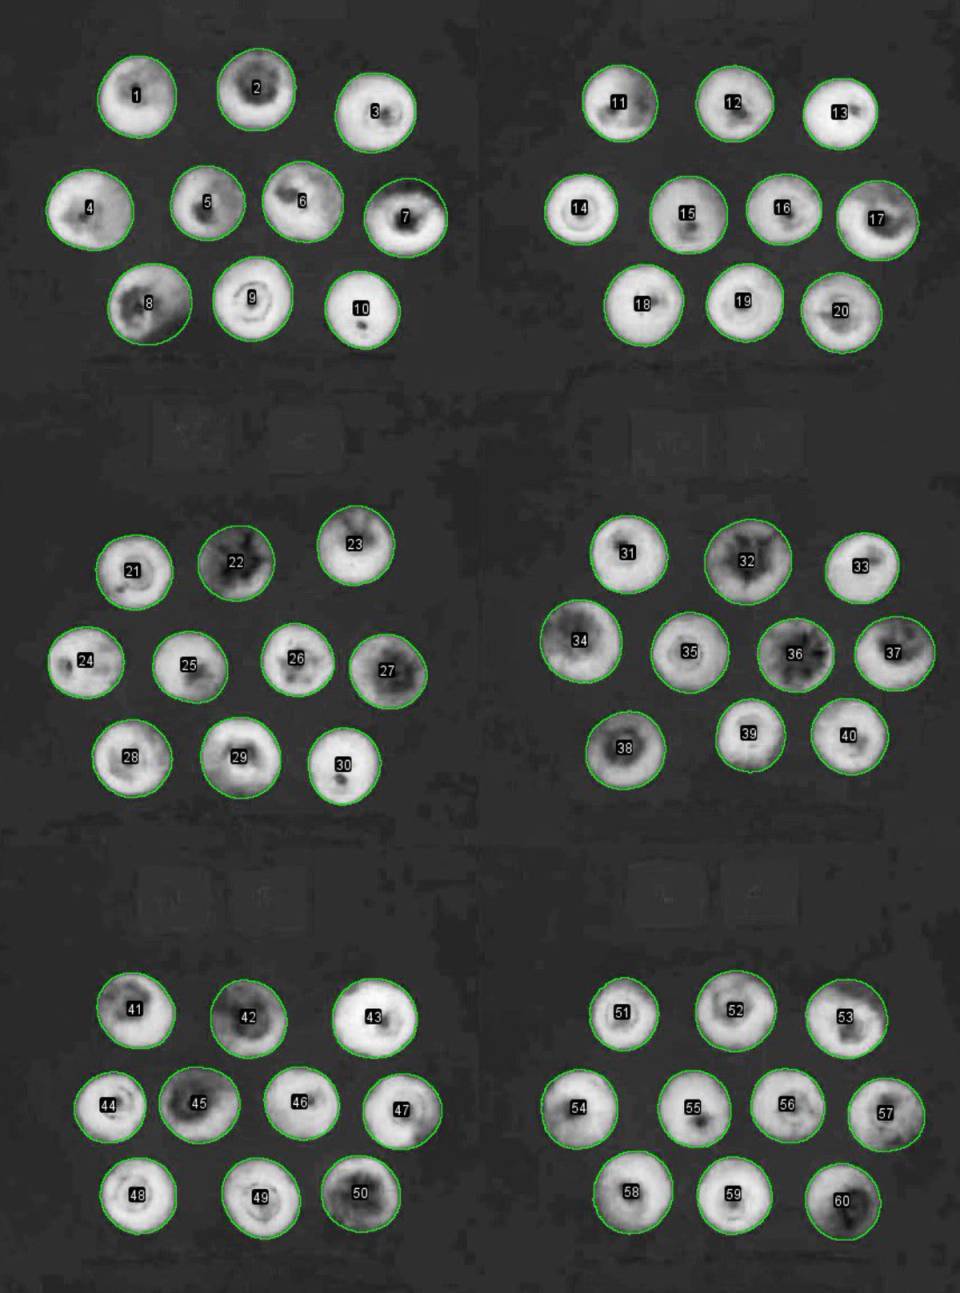
Figure 1 Example of image processing used to measure the amount of red colour for each apple. Brighter areas represent more red colour (a*) measured per pixel. In addition to measuring colour, AgIntelligent® Imaging measures apple size more precisely than handheld calipers.
AgIntelligent® Imaging operates in the CIE Lab colour space to measure:
- a* - red / green
- b* - yellow (orange)
- L* - lightness / darkness
In addition to these direct measurements, the system also calculates:
- C* - colour intensity
- h° - hue angle
- ΔE - Delta E
Delta E is an internationally recognised and ubiquitous method to quantify the difference in colour between objects.
Figure below is the original 1976 Delta E equation from the Commission Internationale de l'Eclairage (CIE) or International Commission on Illumination.
This is the most basic Delta E equation and well suited to our job of comparing apples with apples.
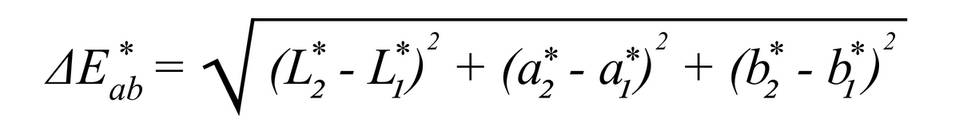
Figure 2 Delta E 1976 - quantifying difference in colour between objects.
The higher the Delta E value, the more obvious the colour difference is between objects.
Delta E values less than <1 are not considered to be perceptible by the human eye.
Professionals who work in colour, such as vehicle repairers, printers and fruit buyers, will likely be able to perceive differences in colour with Delta E around 1 or more. This is especially true when objects are in close proximity, with consistent lighting, such as fruit at the market.
The higher the Delta E value, the easier it is for the human eye to see the difference in colour between objects, especially with variable lighting and when objects are further apart, such as walking between rows or driving between blocks in the orchard.
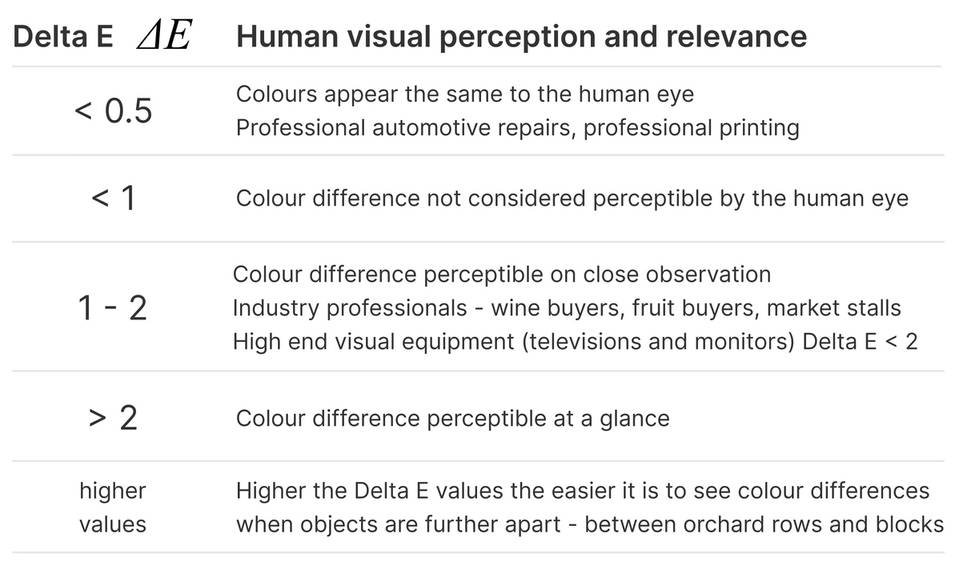
Table 1 Summary of human visual perception and relevance of Delta E values.
Results and Discussion
Results - apple colour
- +18% red colour (a* mode)
Being able to quantify apple colour with AgIntelligent® Imaging is a valuable tool.
Now that we can quantify colour, and we've removed errors of human perception, we can get a clear and valuable picture of various apple colour characteristics.
Quick note on statistics - the "average" should be the start of the discussion, not the end. The distribution of yield (variability) around the "average" is as important, if not more so, than the "average" value itself.
Yes, we significantly move the average. Precision ripening also reduces the variability.
Yield density plots - these are an intuitive way to see how apple yield is distributed. The higher the peak, the more yield in that particular area. The attribute we are measuring is on the horizontal axis.
Bar charts - once we've graded fruit into bins we can express the yield best as a bar chart.
Generally we see the full yield distribution (density plot) first, then we see the yield of fruit per bin (bar chart).
Figure 3 is the combined results of apple colour (red) across all 3 orchards, 6 blocks harvested over a 4 weeks period.
Premium colour is defined as above average in the grower standard.
Medium colour is below average.
Poor colour is pretty much green.
The further to the right, the more red apple colour.
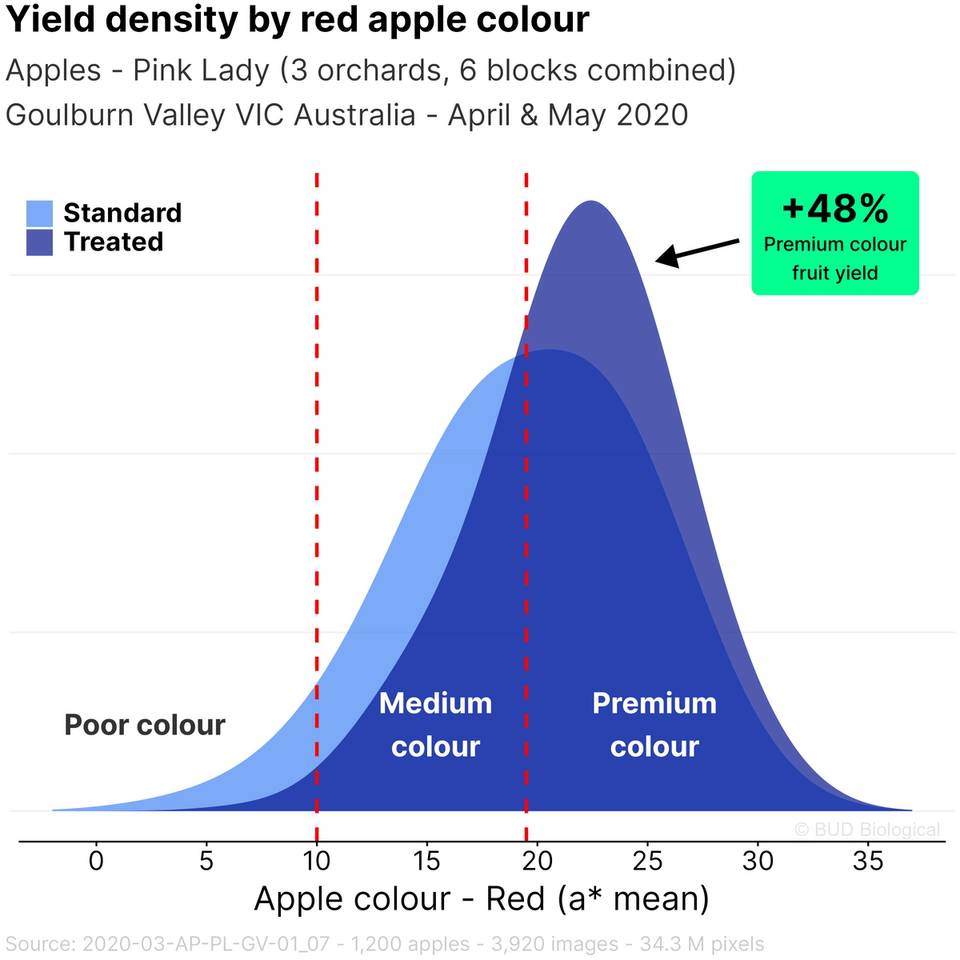
Figure 3 SUNRED and FOLICIST Treated apples are significantly more red measured across a combined 3 orchards, 6 blocks in the Goulburn Valley from 7 April to 7 May 2020. Apple colour measured with AgIntelligent® Imaging. N = 1,080 apples; 3,920 images; 34.3 million pixels, p<0.001
Note - the reddest of red apples, individually, aren't any different Treated or Standard, there's simply more of them in the SUNRED Treated areas. Less green apples if you like.
With any apple variety, there'll be a genetic ceiling on maximum colour.
For individual apples:
Where it's red, it's red.
Where it's green, it's green.
What we are colouring up, is the area in between.
When we grade these apples into colour bins, Figure 4, we see yield of Standard is, by definition, split 50/50 around the average. SUNRED and FOLICIST Treated apple yield is split 70/30 around the same red value.
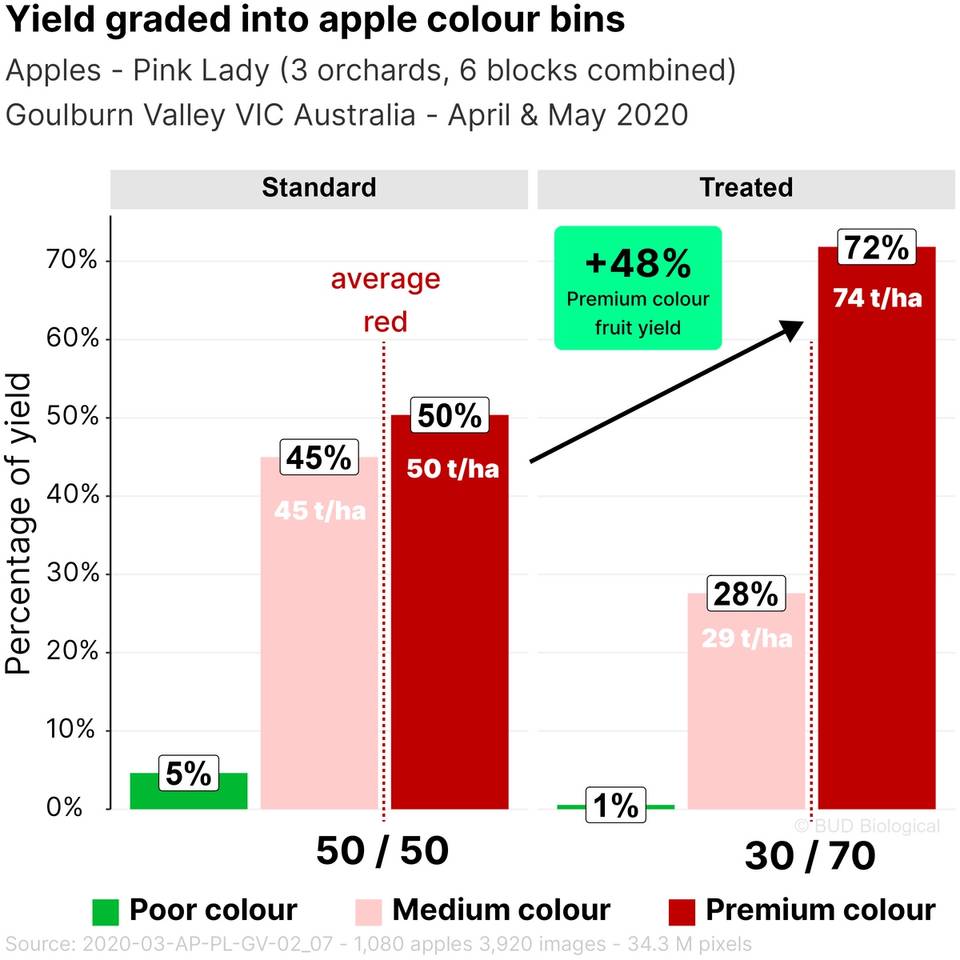
Figure 4 Yield of SUNRED and FOLICIST Treated apples 72% above average compared to Standard apples 50%. Apple colour graded around Standard average red value; Premium colour defined as above average; Medium colour below average; Poor colour almost green. N = 3 orchards; 6 blocks; 1,080 apples; 3,920 images; 34.3 million pixels, p<0.001
We take a Standard 50/50 split of red apple colour and with SUNRED make it 70/30 in our favour.
Compounding returns
Important to note here that we have compounding returns.
SUNRED Treated apple colour is increasing more (+18% average) than Standard apples at the same time that SUNRED Treated apple weight is increasing more (+5.5g average) than Standard apples.
We get paid per kg, not per apple. We have compounding returns of more colour on top of heavier apples. Higher percentages of higher absolute yields.
Based on +3.2% increased average apple weight, example yields per ha are:
Standard 100 t/ha
Treated 103.2 t/ha
We see in Figure 4, after grading the apples into bins based on red colour we see a +48% yield increase for premium "above average" coloured fruit. A 22% increase on a higher yield represents an absolute yield increase of 24 t/ha or 48%.
Looking at all the data combined across 3 orchards, 6 blocks, harvested over a 4 week period, is valuable from a statistical perspective (large sample size) and demonstrates a consistent cause and effect.
These 6 blocks had different management, some were being managed for the early market whilst others were going into long term storage or for export.
Trends in individual blocks
It is valuable to drill into individual blocks to see trends and understand how we best manage these blocks.
Figure 5 looks at colour across one particular block. Clearly there is a colour trend across the block, increasing from left to right. This is consistent with the soil in this block. It's reasonable to say most blocks have variability in apple colour across the block for many reasons, natural (soil type) and/or man made (blocked irrigation lines).
This grower sprayed the majority of their blocks with SUNRED and FOLICIST, deciding to leave 4 rows in the middle of the block not sprayed, for observation.
Rows in the block are numbered and include:
E = East facing side of tree
W = West facing side of tree
Rows 18-19 and 22-23 were buffer rows. Total number of rows in this block about 40.
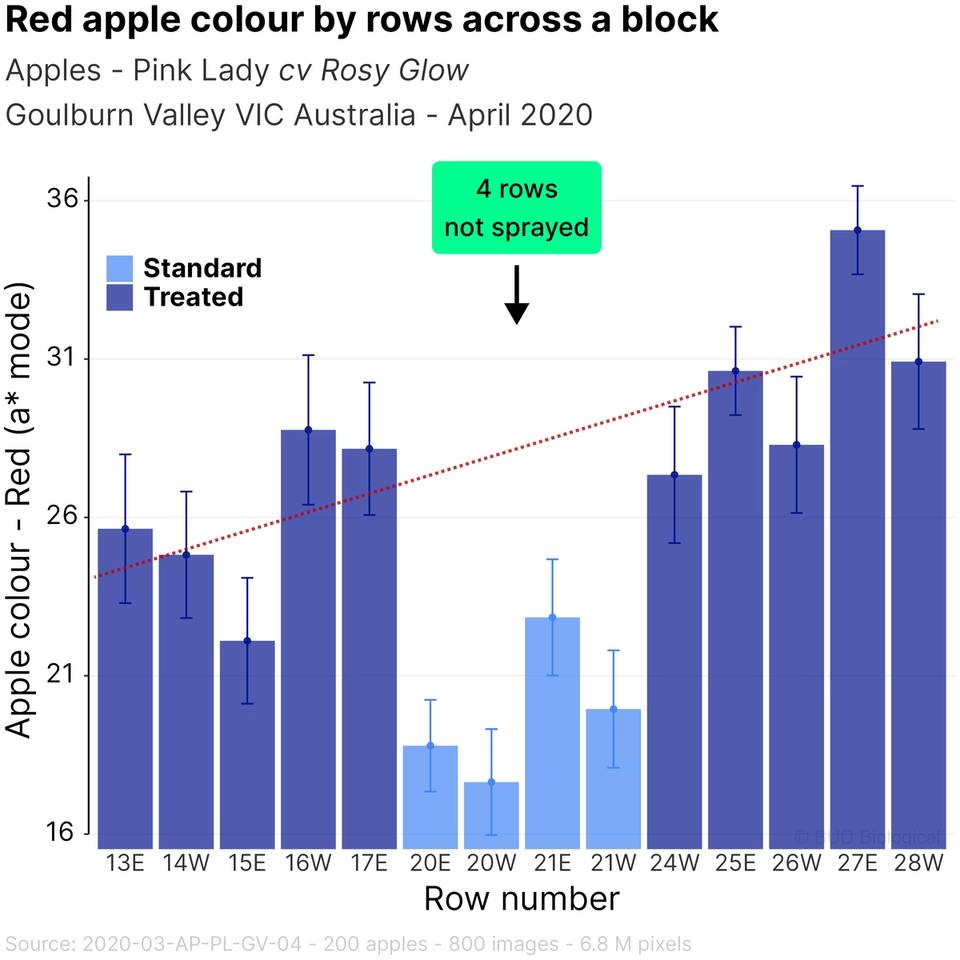
Figure 5 Apples in SUNRED and FOLICIST Treated rows are significantly more red. Note trend in colour increasing left to right across the block. Apple colour measured with AgIntelligent® Imaging. N = 200 apples; 800 images; 6.8 million pixels, p<0.001
Fruit maturity and colour development
Apple colour development has a number of moving parts.
Two key ones are:
- Green diminishes - as chlorophyll is degraded
- Red accumulates - as anthocyanins are produced, transported, stored and stabilised
Apple colour production ≠ apple colour accumulation
We need to protect the red colour we produce from oxidation in the apple peel. Managing both sides of this equation is key to achieving optimal colour at harvest.
We can think of the biological production, transport, storage and stabilisation of anthocyanins (colour) in the same way we produce our apples: we produce apples in the paddock, transport them to the shed and store them in a stabilised (controlled) environment - every step is critical. This is the same for producing premium apple colour at the biological level.
Phenylalanine (in SUNRED) is the fuel that drives anthocyanin (colour) and lignin (firmness) production. Production of colour is not the end though.
Various anti-oxidants and other compounds (co-pigments) in the apple peel are responsible for the successful transport, storage and stabilisation of the anthocyanins (colour). When this process is running optimally, it allows anthocyanins (colour) to accumulate to the maximum extent possible.
When we see colour coming in then fading out with warmer weather, or photo-oxidative sunburn, it's a good sign we could be doing more to transport, store and stabilise (protect) the colour we've already produced in our apples.
We achieve optimal red apple colour at harvest when we pro-actively manage both the production and safe storage of stabilised anthocyanins (colour).
We typically see colour developing when we wouldn't necessarily expect it and the colour is stable, it doesn't fade with warmer weather.
Colour quality / tone is also improved with stabilised anthocyanins (colour) - in this study we measured less orange (-4%) on the sun exposed sides of the apples from the western side of the trees.
In terms of green diminishing (chlorophyll degradation) - it's important to ensure our leaves are as healthy and photosynthetically active as possible. This signals to the tree that it can safely breakdown the chlorophyll (reduce the green) in the apple fruit itself, that there is sufficient carbohydrate (sugar) being produced in the leaves to ripen the fruit.
"We're just waiting for colour"
We don't recommend this approach. Active management is required for optimal colour, fruit quality and yield.
We see the relationship between colour development and fruit maturity of a single block illustrated in Figure 6. This particular block yielded 116 t/ha.
Note earlier development and accumulation of red colour in the SUNRED and FOLICIST treated apples leading to a higher red peak. Like train tracks, these two lines are heading in the same direction but never meet up, no matter how long we wait.
Apple colour doesn't catch up with time, rather, it oxidises and the fruit over matures.
We can see that whatever stage of fruit maturity we harvest this block, there is always significantly more colour on average with SUNRED and FOLICIST Treated (dark blue line).
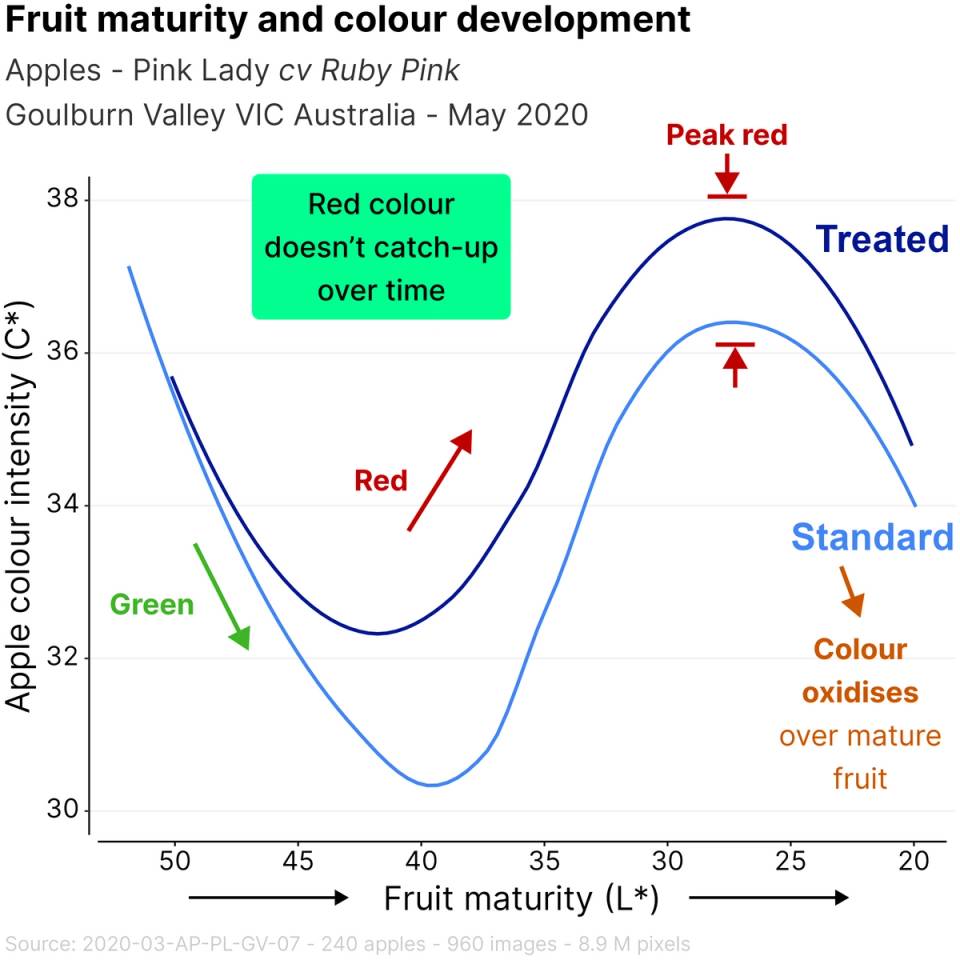
Figure 6 Apple colour doesn't catch up with time, SUNRED and FOLICIST Treated apples always have more colour. Green colour diminishes as chlorophyll is degraded. Red colour increases to a peak then diminishes as it oxidises. Colour and fruit maturity measured with AgIntelligent® Imaging. Relationship (polynomial regression) between fruit maturity and colour development. This block yielded 116 t/ha. N = 240 apples, 960 images, 8.9 million pixels. Colour intensity (C*) p<0.001
Colour by apple aspect
AgIntelligent® Imaging measures the colour of four apple aspects individually, giving us valuable insights into our colour management.
These aspects are:
- Top - top of the apple
- Exposed side - side with the most red
- Shaded side - side with the least red
- Bottom - bottom of the apple
We collect samples in the field and take them back to the shed for AgIntelligent® Imaging. Therefore, the Exposed side and Shaded side are arbitrarily identified back in the shed, most red colour is the Exposed side and least red colour is the Shaded side.
SUNRED in addition to various PGRs, reflective cloth and leaf blower all combined
SUNRED and FOLICIST are a valuable addition to any colouring program, simply on their own or further improving the effectiveness (maximising ROI) of PGRs, reflective cloth or leaf blowing.
In Figure 7 we see the effects of SUNRED and FOLICIST combined results across 3 orchards, 6 blocks using a variety of PGRs, reflective cloth and leaf blower, harvested over a 4 week period from 7 April to 7 May 2020 .
Standard - various PGRs, reflective cloth and leaf blower
Treated - Standard plus SUNRED and FOLICIST
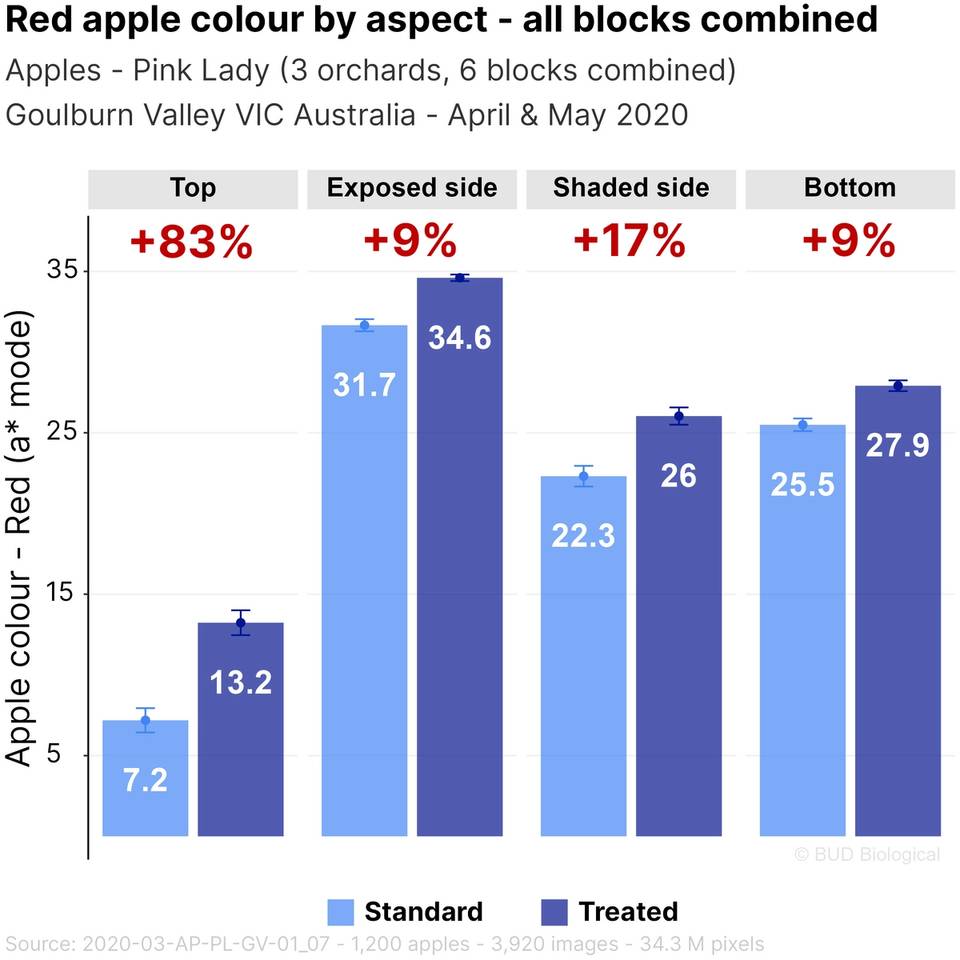
Figure 7 SUNRED and FOLICIST Treated apples are more red on every apple aspect. The greatest percentage increase is the Top and Shaded side of the apples - the least light exposed and hardest to colour. SUNRED Treated apple colour is increased over and above various combinations of PGRs, reflective cloth and leaf blowing (Standard). Colour measured with AgIntelligent® Imaging. N = 3 orchards; 6 blocks; 1,080 apples; 3,920 images; 34.3 million pixels, p<0.001
Colour management with tools including PGRs, reflective cloth and leaf blowers
The growers who are applying SUNRED are doing so because they recognise the very significant commercial gains from pro-actively managing fruit ripening uniformity, colour and maturity. These growers are generally already using various combinations of PGRs, reflective materials and leaf blowers.
Many and various combinations over the years with SUNRED and FOLICIST have been successfully applied in the field.
Much time and expense is spent on colour management and including SUNRED and FOLICIST in the program is key for maximum return on investment.
PGRs were also applied across most of these reflective cloth and leaf blower blocks too.
SUNRED in addition to reflective cloth
SUNRED and FOLICIST significantly improves the red colour effectiveness and ROI of reflective cloth.
In Figure 8 we see the effects of SUNRED and FOLICIST in addition to using reflective (white) cloth:
Standard - reflective cloth
Treated - reflective cloth plus SUNRED and FOLICIST
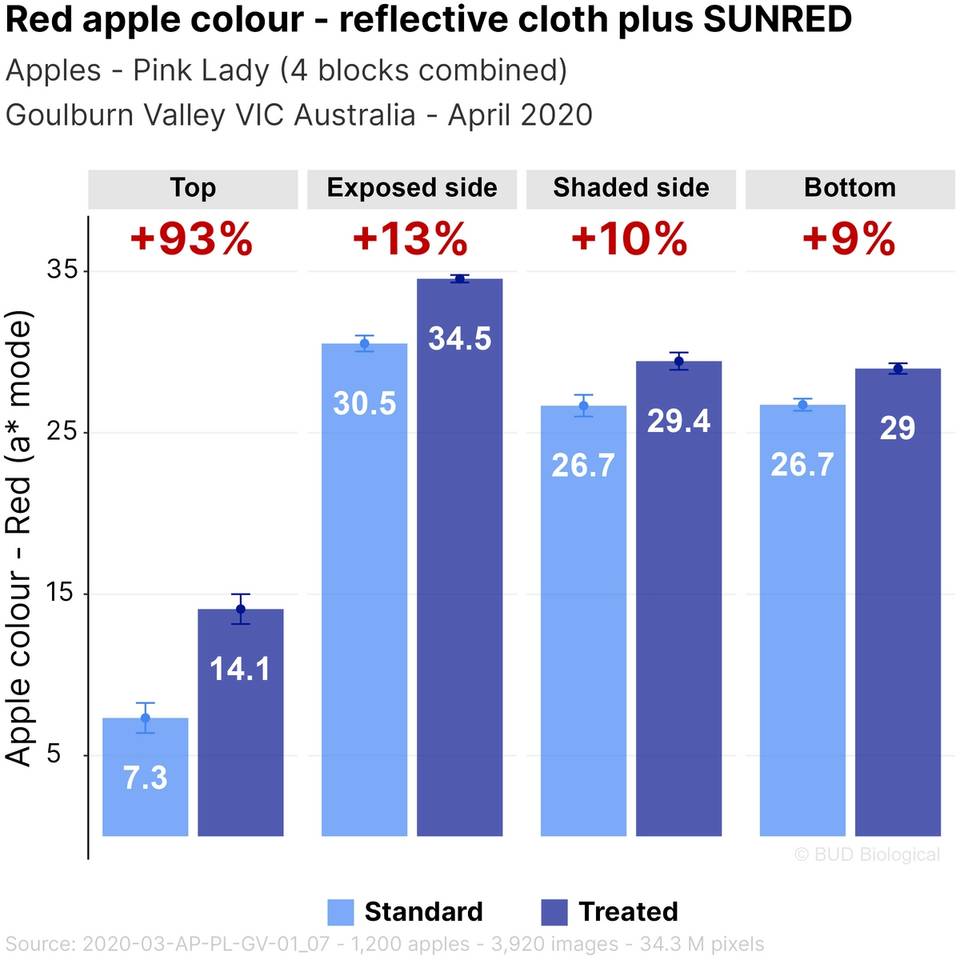
Figure 8 SUNRED and FOLICIST Treated apples are more red on every apple aspect, in addition to the effects of reflective (white) cloth. The greatest percentage increase is the Top of the apples - the least light exposed and hardest to colour. Colour measured with AgIntelligent® Imaging. N = 4 blocks; 800 apples; 2,800 images; 23.9 million pixels, p<0.001
SUNRED in addition to the leaf blower
SUNRED and FOLICIST significantly improves the red colour effectiveness and ROI of a leaf blower.
In Figure 9 we see the effects of SUNRED and FOLICIST in addition to using a leaf blower:
Standard - leaf blower
Treated - leaf blower plus SUNRED and FOLICIST
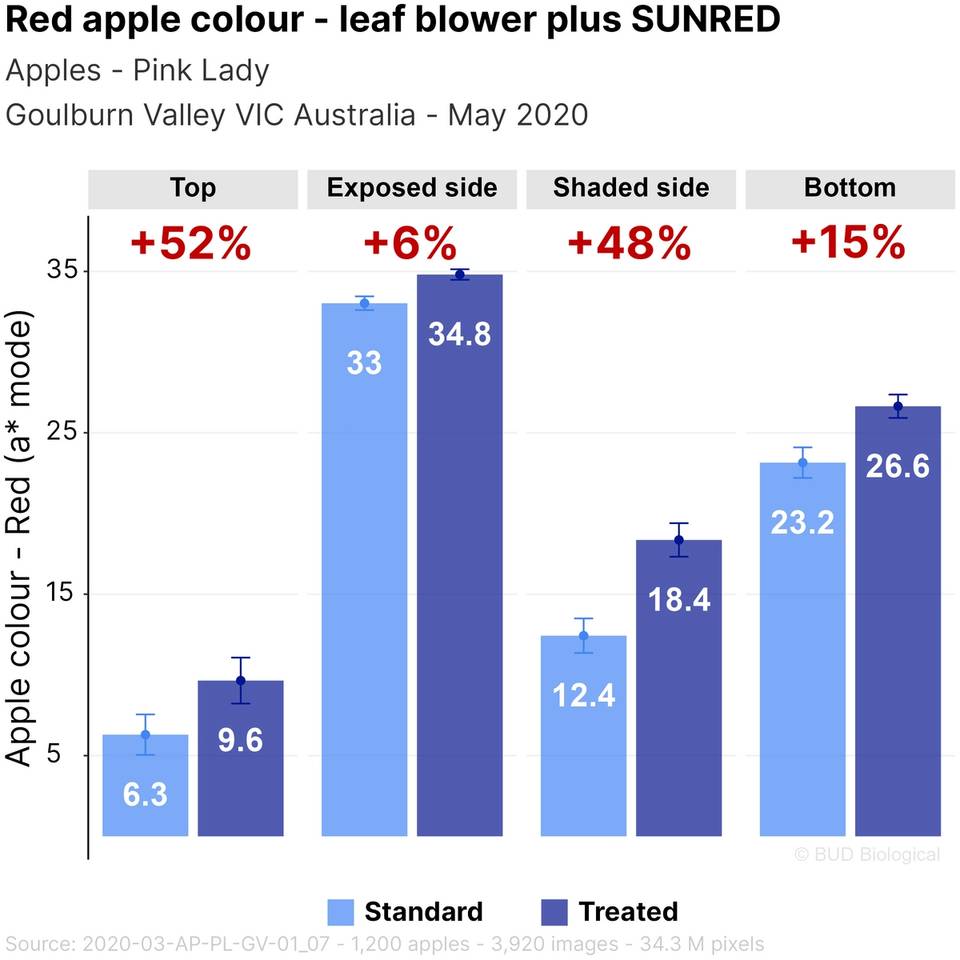
Figure 9 SUNRED and FOLICIST Treated apples are more red on every apple aspect, in addition to the effects of a leaf blower. The greatest percentage increase is the Top and Shaded side of the apples - the least light exposed and hardest to colour. Colour measured with AgIntelligent® Imaging. N = 240 apples; 960 images; 8.9 million pixels, p<0.001
Apple colour by east and west facing sides of the tree
In addition to significantly increased red apple colour, SUNRED and FOLICIST Treated apples had significantly less orange (colour oxidation) in apples harvested from the west facing side of the trees.
We've looked at the influence of SUNRED and FOLICIST on four apple aspects, Figure 10 illustrates the increase in red apple colour according to the East or West facing side of the trees. Important to also note the significant reduction in orange apple colour (colour oxidation) on the West side of the trees. This is likely due to a combination of photo-oxidation (sunburn) and heat oxidation of the colour (heat stress).
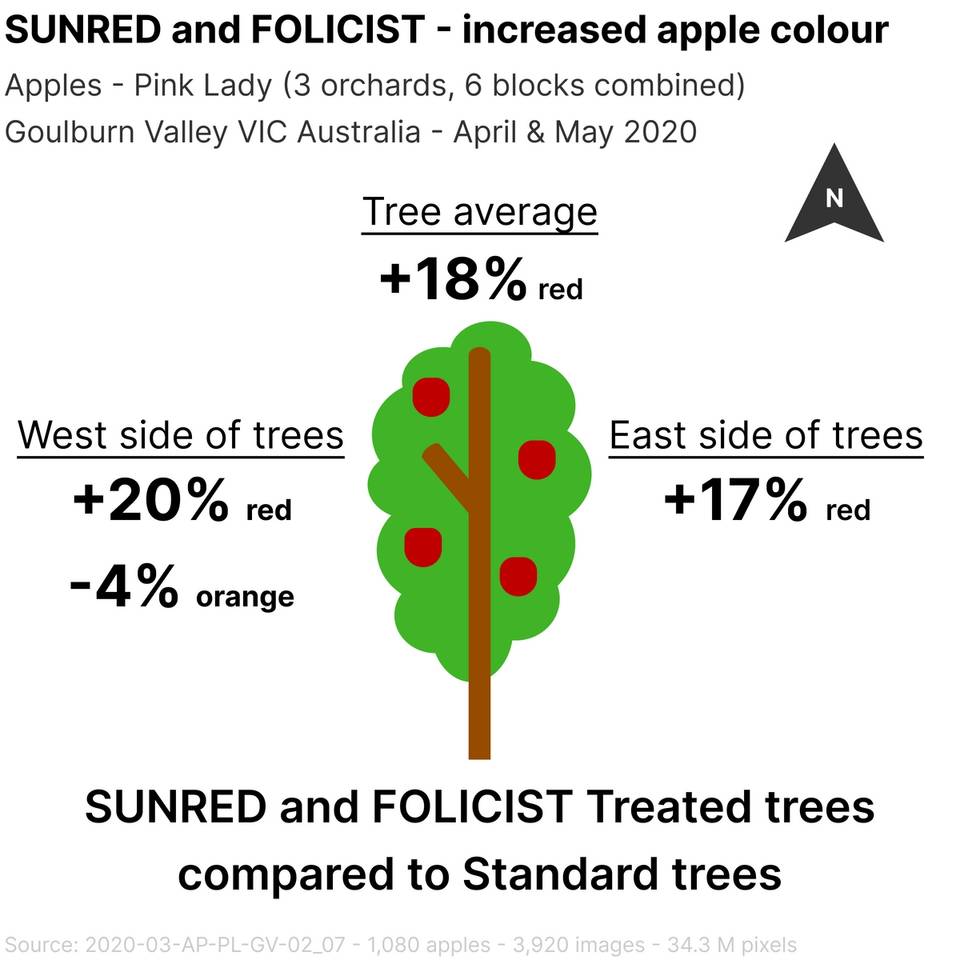
Figure 10 SUNRED and FOLICIST significantly increased red apple colour on both the East and West side of the trees and significantly reduced the amount of orange (colour oxidation) on the West side of the trees. Colour measured with AgIntelligent® Imaging. N = 3 orchards; 6 blocks; 1,080 apples; 3,920 images; 34.3 million pixels, p<0.001
Apple colour differences expressed as Delta E (ΔE)
As described in the Materials and Methods section, we quantify the difference in colour, and human perception, between apples with Delta E (ΔE).
Figure 11 illustrates the Delta E values when we compare SUNRED and FOLICIST Treated trees with Standard trees. We see significant colour differences on both the East and West sides of the trees with the largest colour difference on the West. This is also due to SUNRED and FOLICIST protecting the red colour from oxidation, refer Figure 10, as significantly less orange apple colour.
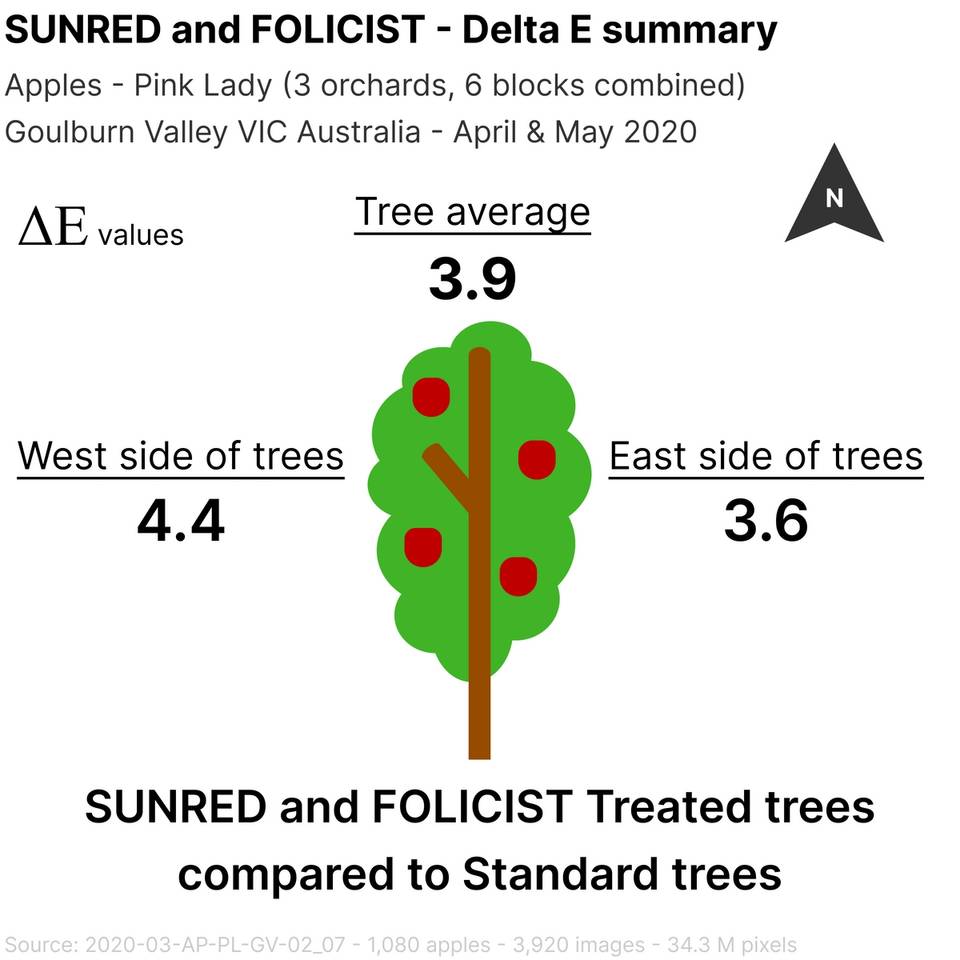
Figure 11 SUNRED and FOLICIST apples are substantially different in colour as quantified by Delta E values. Colour measured with AgIntelligent® Imaging. N = 3 orchards; 6 blocks; 1,080 apples; 3,920 images; 34.3 million pixels
Apple colour differences between East and West sides of the trees
SUNRED and FOLICIST Treated trees have improved colour uniformity between apples harvested from the east and west facing sides of the trees compared to Standard trees.
We are challenged with colour variability in our orchards for a number of reasons. One of these reasons is the East and West facing aspects of the trees.
Trees have different requirements for optimal colour on each side of the tree:
- East side - colour development is key
- West side - colour protection is key
By adopting biological precision ripening with SUNRED and FOLICIST we are more precisely able to meet the needs of both the East and West side of the trees.
The result is substantially less colour difference between apples harvested from the East or West sides of the trees. This is quantified with Delta E as expressed in Figure 12 below.
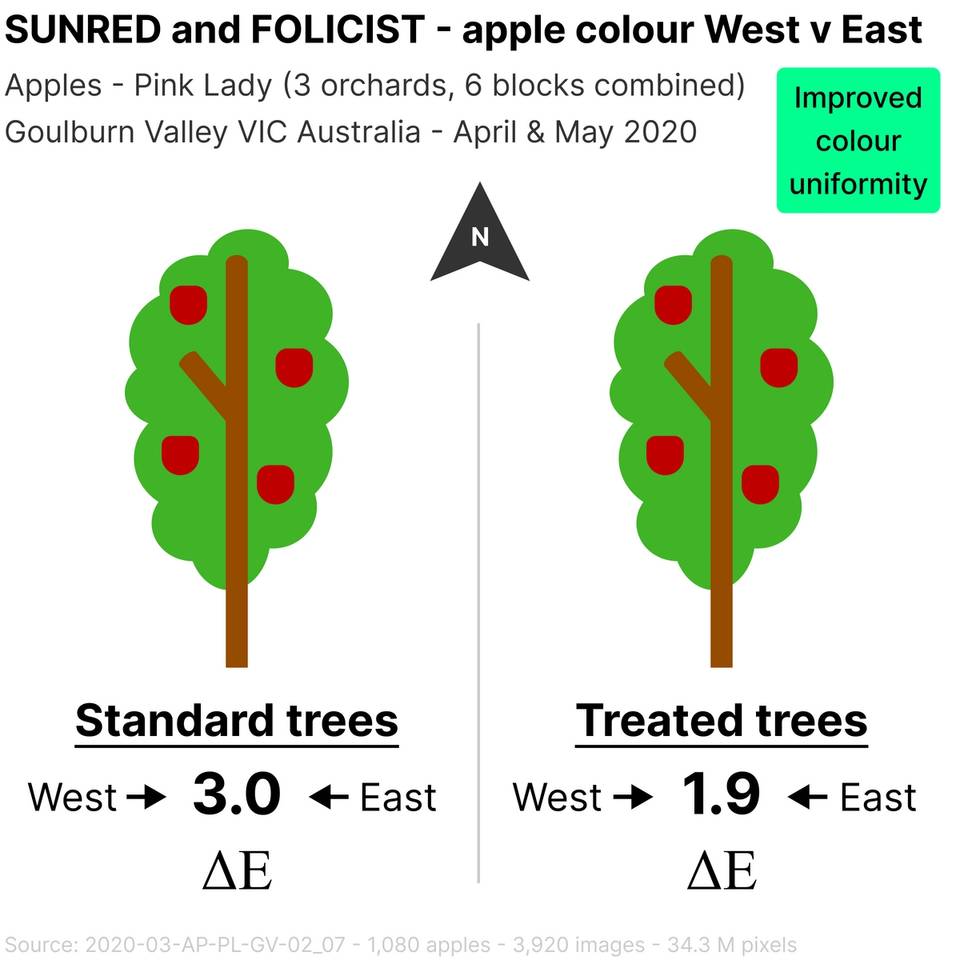
Figure 12 SUNRED and FOLICIST apples from the East vs West side of the Treated trees are closer in colour (ΔE = 1.9) compared to the East vs West side of Standard trees (ΔE = 3.0). Colour measured with AgIntelligent® Imaging. N = 3 orchards; 6 blocks; 1,080 apples; 3,920 images; 34.3 million pixels
Results - apple weight
- +5.5g per apple (for apples <200g)
With precision ripening, it's the small fruit that sizes up the most.
Pink Lady apples over >200 g are generally graded out for juice. With precision ripening we improve fruit size uniformity which accounts for this significant increase in apple weight.
Increase in apple weight is driven by fruit size uniformity - less small fruit rather than bigger fruit. This reflects the management of a variety such as Pink Lady where we may not be pushing too much size close to harvest.
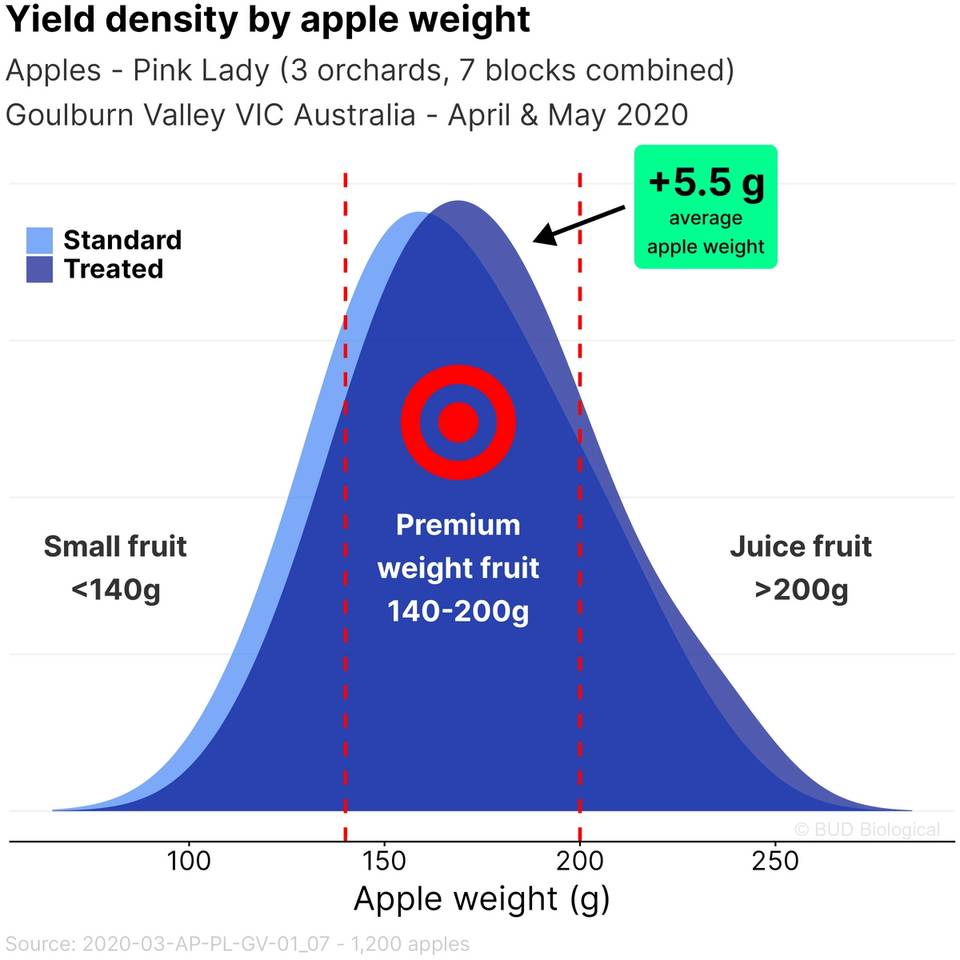
Figure 13 Less small fruit - SUNRED and FOLICIST Treated apples are 5.5 g heavier on average once the juice size (>200 g) apples are graded out. N = 3 orchards; 7 blocks; 1,200 apples, p<0.001
Figure 14 below illustrates grading these apples into weight bins and an +11% increase in yield of premium weight apples.
Small fruit <140g increases our packaging costs and is lost potential of a heavier piece of fruit in that same fruiting position.
Premium fruit 140-200g maximises yield, premium pack out and profitability.
Juice fruit >200g goes to juice at a lower value per kg than premium fruit
Note - increase in average apple weight is driven by less small fruit. There is minimal change in the yield of apples going to juice >200g.
This is typical of precision ripening across crops and varieties - SUNRED and FOLICIST Treated fruit typically has much less variability both top and bottom of the range.
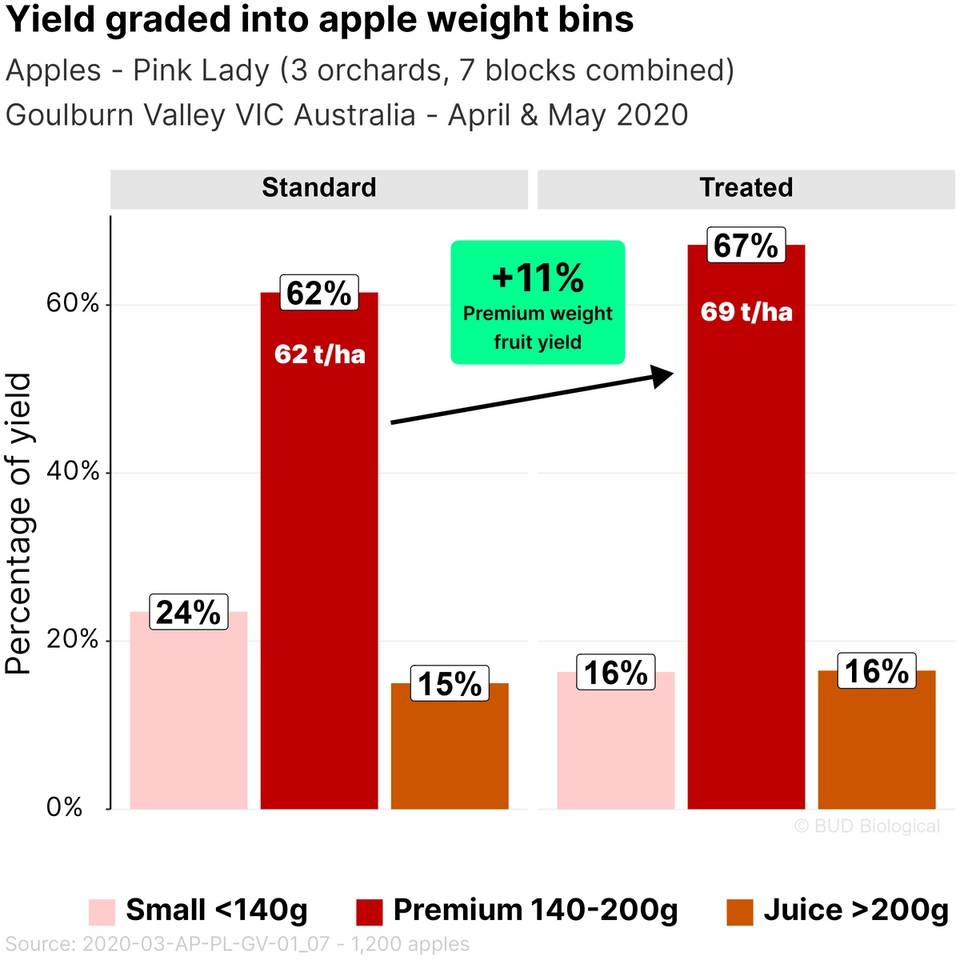
Figure 14 Grading apples into weight bins clearly shows improvement in fruit size uniformity of SUNRED and FOLICIST Treated apples, a 5.5g per apple average weight increase and +11% yield of premium size apples in absolute yield terms. N = 3 orchards; 7 blocks; 1,200 apples, p<0.001
Table 2 summarises the apple weight statistics by size bin. Note the average difference of apples <200g is +5.5g for SUNRED and FOLICIST, slightly higher than the overall average increase of +5.3g for SUNRED and FOLICIST across all size bins.
With precision ripening, it's the smallest apples that size up the most.
Note trend in juice size apples >200 g to weigh less -2.5g. Given the smaller sample size (N=189) of juice size apples this is not a statistically significant difference on this occasion. This trend is consistent with other research and with a larger sample size it is expected there would be statistically less oversize juice fruit with SUNRED and FOLICIST.
Table 2 SUNRED and FOLICIST Treated apples weigh +5.5g (+3.6%) after we grade out juice size (>200g) apples. The smaller apples size up the most. There is a trend for less oversize juice apples (>200g). This is consistent with other research although is not statistical here given smaller sample size of juice size apples. N = 3 orchards; 7 blocks; 1,200 apples, p<0.001
Combined results - apple colour and weight
Ultimately, we want increased yields of fruit that is both premium colour (the more red the better) and premium weight (not too big, not too small).
As Figure 15 shows, SUNRED and FOLICIST drive increased colour and fruit size uniformity. The biggest gains are from less small, green fruit by comparison to the Standard yield. Note the shaded areas capture 95% of the yield for these blocks. The SUNRED and FOLICIST Treated yield is more concentrated where we want it.
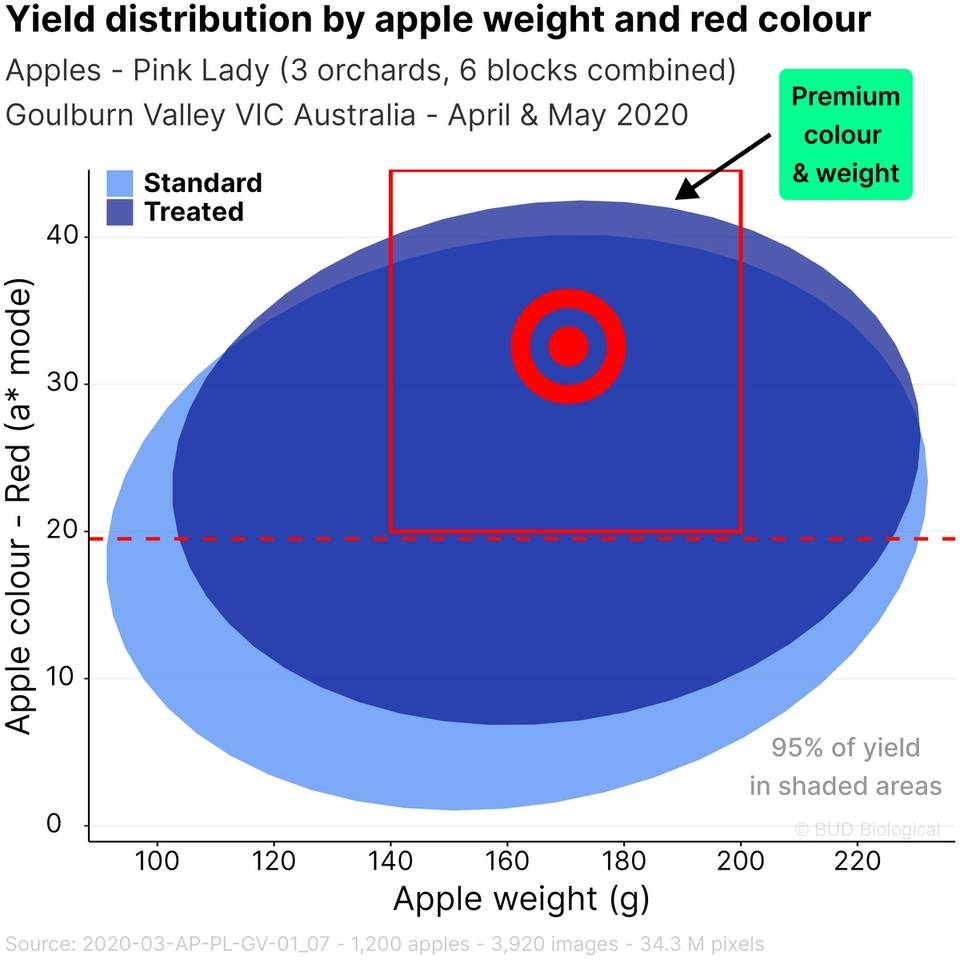
Figure 15 SUNRED and FOLICIST Treated apples are much more likely to be in both the premium colour and premium weight class; less small, green apples. The shaded areas shows 95% of the yield for SUNRED and FOLICIST Treated and grower Standard apples. N = 3 orchards; 6 blocks; 1,080 apples
Results - apple firmness
- -50% less soft fruit (<8 kg/11mm)
It's best to think of less soft fruit rather than firmer fruit per se.
We see in Figure 16 the SUNRED and FOLICIST Treated apples with half the amount of soft apples (<8 kg/11mm). Also note at the other end there is less of the overly firm, under mature apples.
Precision ripening with SUNRED and FOLICIST improves fruit ripening uniformity, therefore significantly less soft apples.
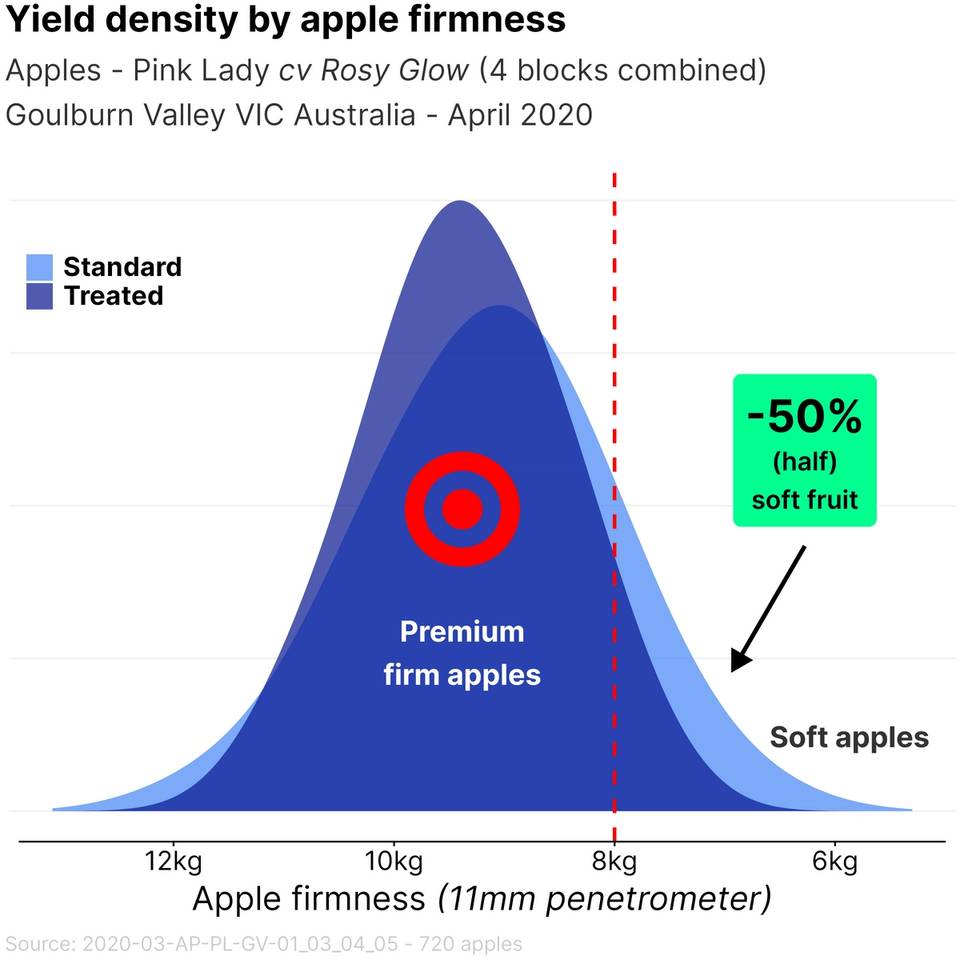
Figure 16 SUNRED and FOLICIST Treated apples have half the amount (-50%) of over mature soft apples (< 8kg/11mm) as measured with a penetrometer. Note less variability in fruit firmness at both too hard and too soft. N = 4 blocks; 720 apples, p=0.009
Figure 17 shows apple firmness by east and west side of the tree. Note uniformity of apple ripeness on both east and west sides of the tree.
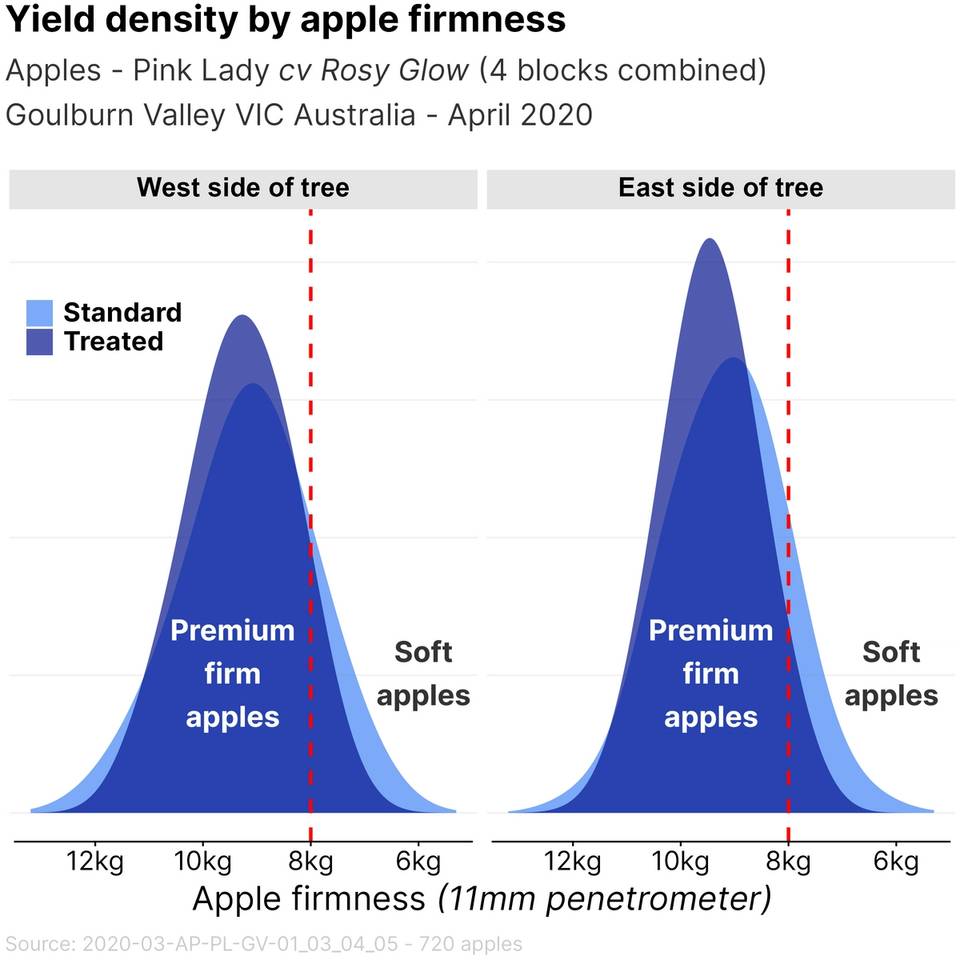
Figure 17 SUNRED and FOLICIST Treated apples have half the amount (-50%) of over mature soft apples (< 8kg/11mm) overall as measured with a penetrometer. Note less variability in fruit firmness at both too hard and too soft. N = 4 blocks; 720 apples, p=0.009
Grading the apples into bins based on firmness shows SUNRED and FOLICIST Treatment with half the yield of soft apples compared to the grower Standard.
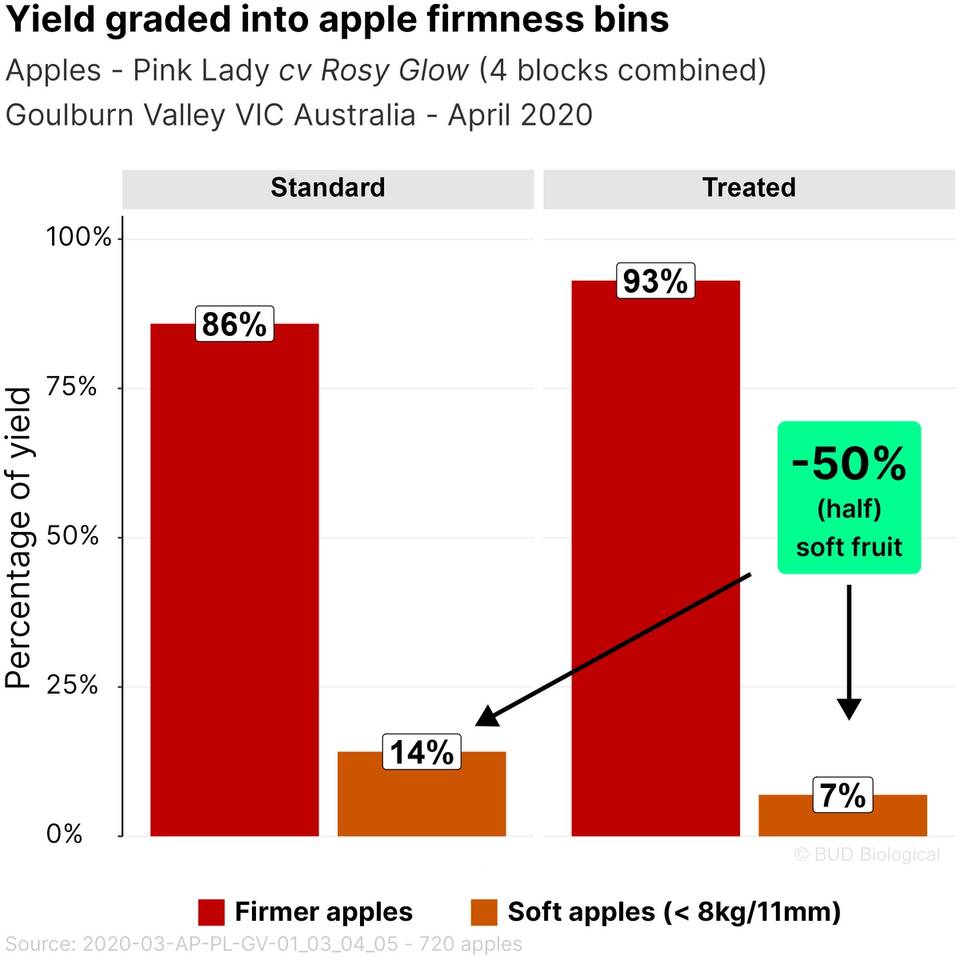
Figure 18 SUNRED and FOLICIST Treated apples yielded half the amount (-50%) of soft fruit compared to grower Standard apples. Yield graded into bins according to apple firmness. N = 4 blocks; 720 apples
Apple firmness was measured across four blocks throughout April 2020. These blocks were managed for different markets.
We see there is differences in apple firmness between blocks due to management and other variables.
We also see apple firmness consistently improved with SUNRED and FOLICIST in each block.
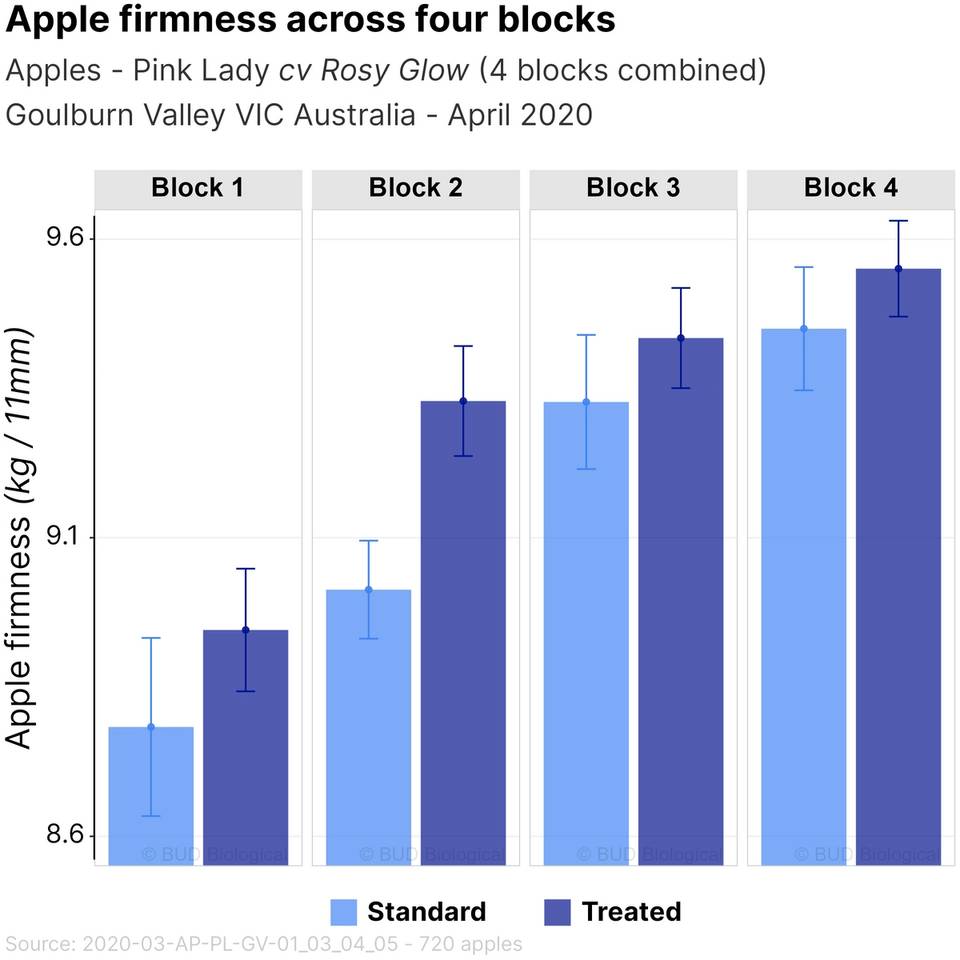
Figure 19 SUNRED and FOLICIST showed consistent improvement in apple firmness in each block. Blocks were managed differently for certain markets in addition to natural variability between blocks. Apple firmness measured with a handheld penetrometer (11 mm). N = 4 blocks; 720 apples, p=0.009
Results - apple maturity
- +20% premium maturity (density) fruit yield
As fruit matures, fruit density decreases.
We can use apple density as a way of measuring fruit maturity.
Apples which are too dense are under mature, apples which are not dense enough are over mature.
There is a premium density (maturity) at which we want to be harvesting our apples.
Precision ripening reduces variability of fruit maturity at harvest. We can see SUNRED and FOLICIST Treated apples are more likely to be harvested at premium maturity compared to the higher variability of the grower Standard apples.
In addition to reduced revenue, we have compounding costs when we pick, transport, store and grade apples that end up going for juice or waste.
Increased uniformity of apple ripening (and to ensure premium colour and weight) is key to maximising profitability.
NB - the block we're looking at here yielded 116 t/ha
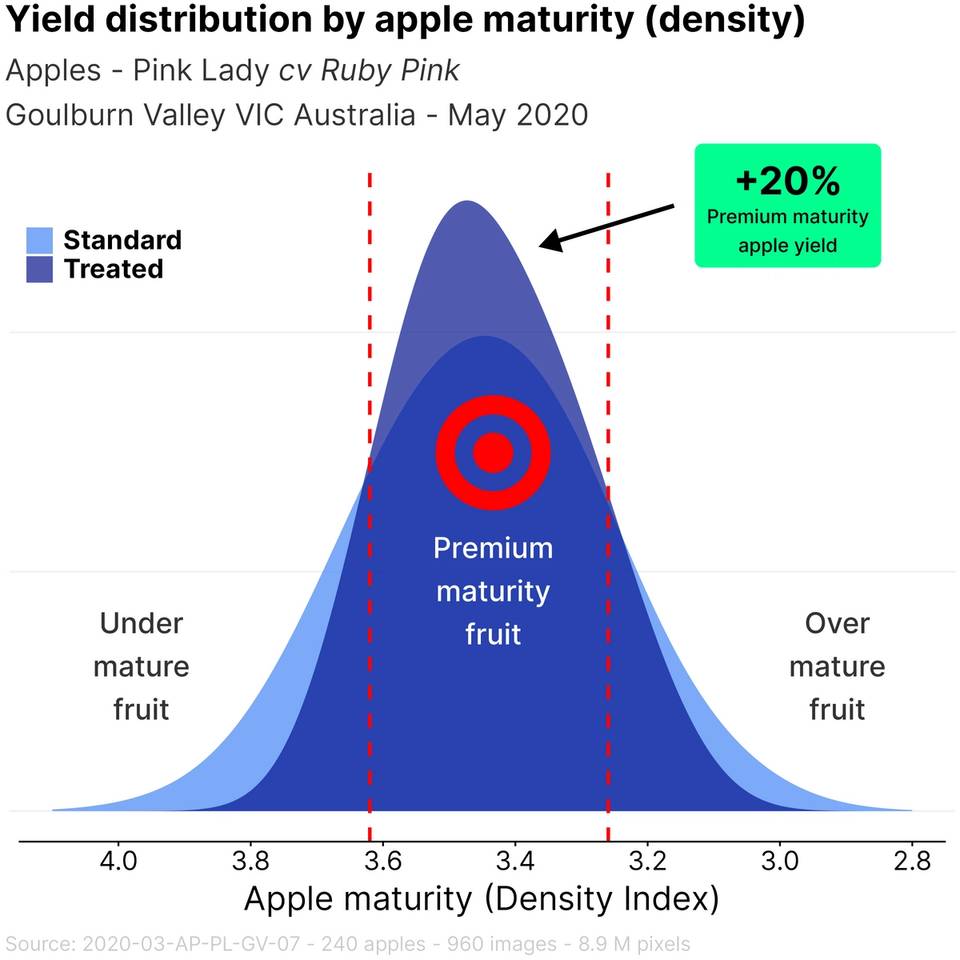
Figure 20 SUNRED and FOLICIST Treated apples are much more uniform in their maturity as measured by apple density. This block yielded 116 t/ha. N = 240 apples
Grading apples into bins based on fruit density we see precision ripening with SUNRED and FOLICIST results in a substantial increase in apples of premium maturity. Both under mature and over mature apples are much less, about half.
SUNRED and FOLICIST with a +20% increase in yield of premium maturity apples.
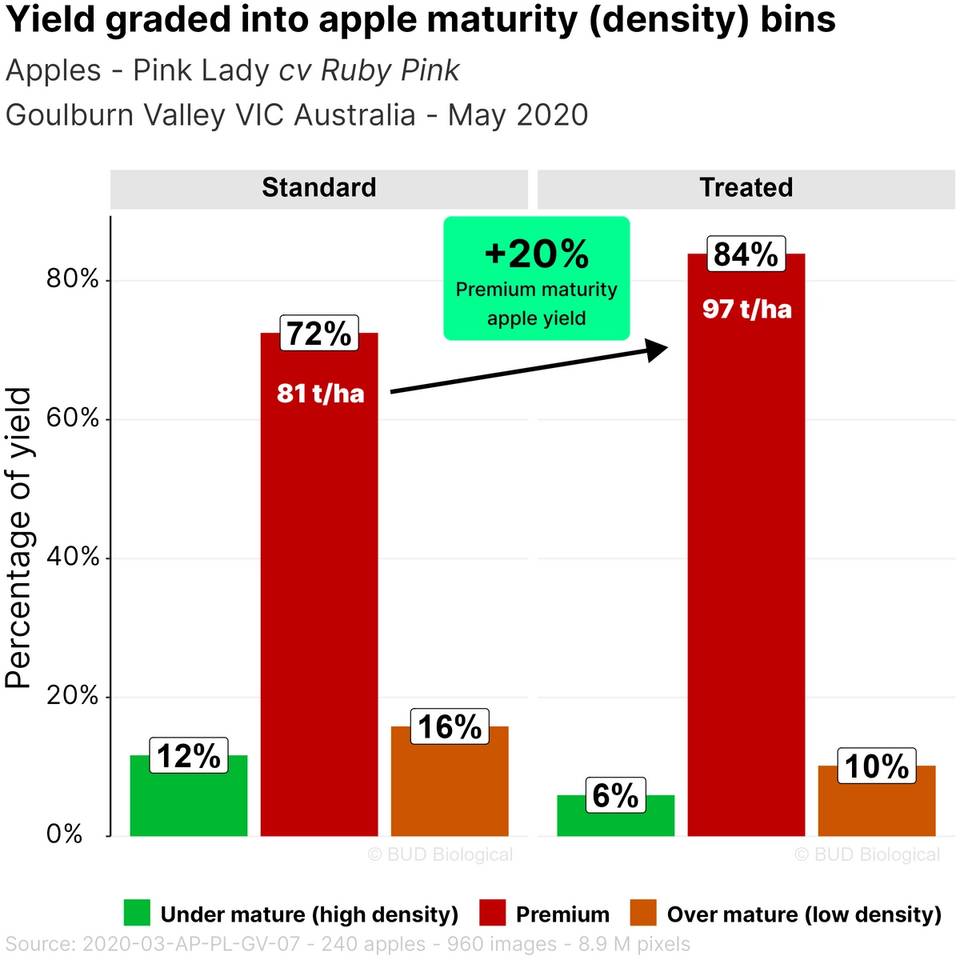
Figure 21 SUNRED and FOLICIST Treated apples are much more uniform in their maturity with an increased yield of +20% of premium maturity fruit. This block yielded 116 t/ha. N = 240 apples
Conclusions
Pre-harvest SUNRED and FOLICIST sprays are a valuable precision ripening tool.
With precision ripening comes significant yield gains in premium fruit - colour, size, firmness and uniform maturity.
It is recommended to include 2 pre-harvest sprays of a SUNRED and FOLICIST tank-mix per the Apple & Pear Program.
Statistics and appendices
For those interested in stats
Table 3 summarises sampling and measurements conducted.
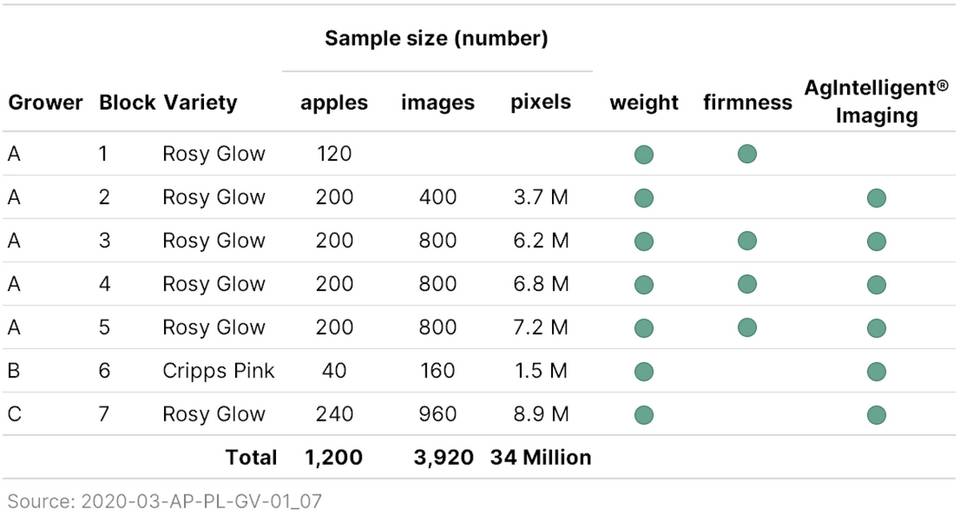
Table 3 Summary of sample sizes and measurements taken during commercial harvest across 3 orchards, 7 blocks in the Goulburn Valley between 7 April and 7 May 2020.
Table 4 summarises various apple colour characteristics, the difference and statistical significance. This is all data combined across 3 orchards, 6 blocks. When we look at only the west side of the trees, SUNRED and FOLICIST Treated apples have significantly less orange (yellow b*).
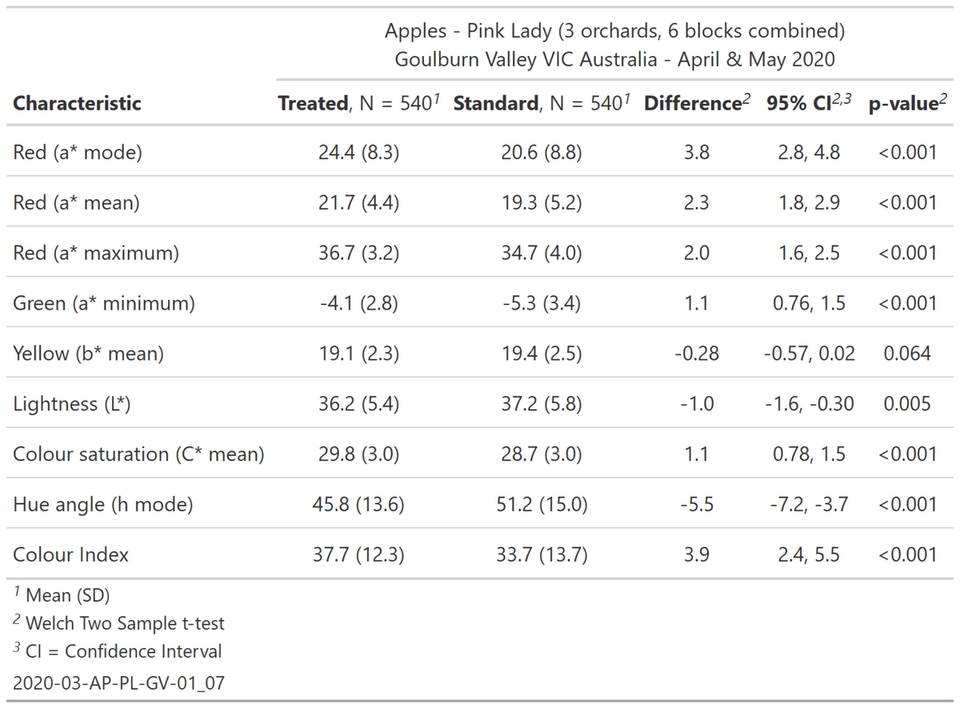
Table 4 SUNRED and FOLICIST Treated apples highly significant differences in all colour characteristics with exception of Yellow (b* mean). When we look at only the Western side of the trees, Yellow (b* mean) is significantly less (-4%) in Treated apples.
Table 5 is summary of percentage difference of each of the above colour characteristics.
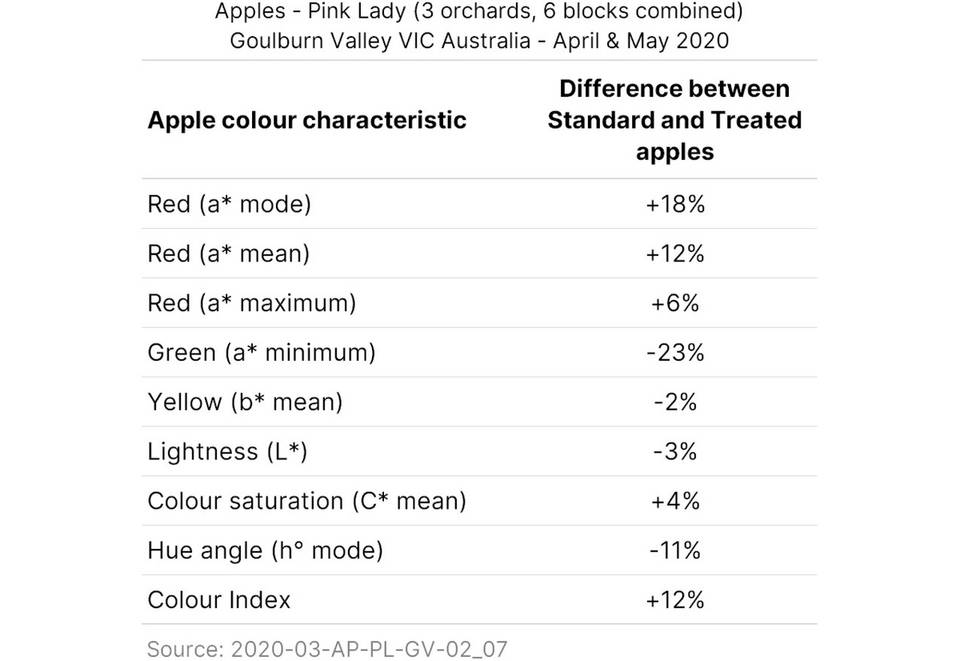
Table 5 Summary of colour characteristics and differences between Standard apples and SUNRED and FOLICIST Treated apples. N = 3 orchards; 6 blocks; 1,080 apples; 3,920 images; 34.3 million pixels
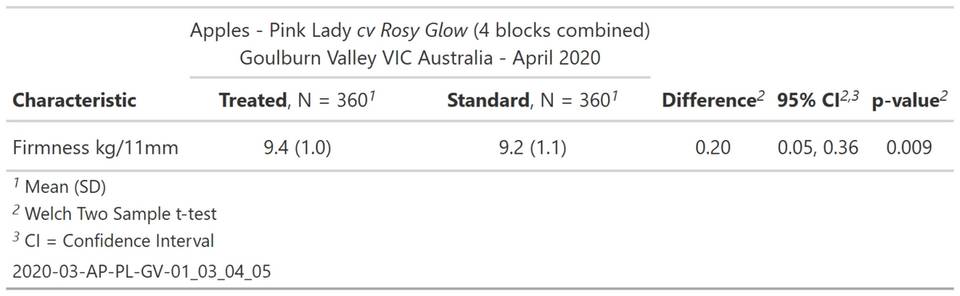
Table 6 Summary statistics of fruit firmness for 720 apples sampled across four Pink Lady cv Rosy Glow blocks in the Goulburn Valley - April 2020
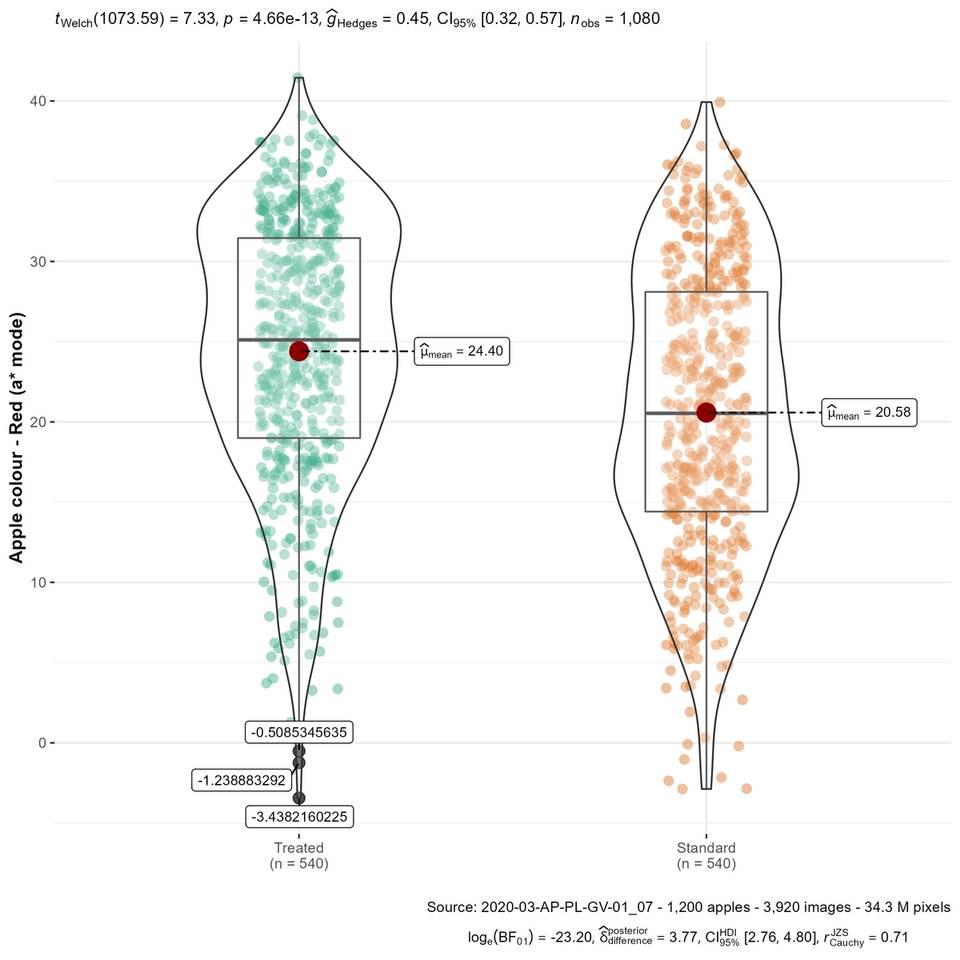
Figure 22 Summary statistics for red apple colour of 1,080 Pink Lady apples sampled across 3 orchards, 6 blocks in the Goulburn Valley VIC, 7 April - 7 May 2020.
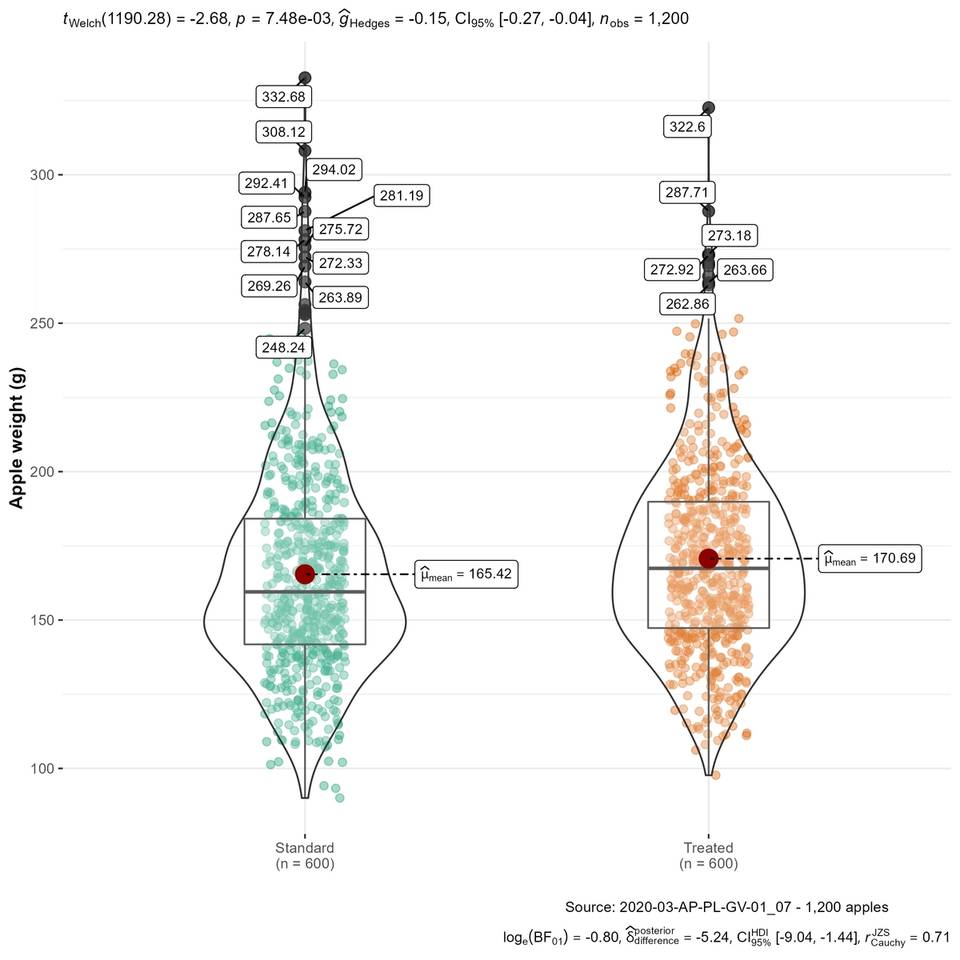
Figure 23 Summary statistics for fruit weight of 1,200 Pink Lady apples sampled across 3 orchards, 7 blocks in the Goulburn Valley VIC, 7 April - 7 May 2020.
Acknowledgements
Thank you to the growers involved for leaving rows unsprayed, loaning the penetrometer and for the use of shed space during a busy time of year.
Related Resources