Pinot Noir - Improved fruit set and yield using biostimulants on the Mornington Peninsula, 2019-20
Fruit set, bunch weight and berry density were significantly improved where the biostimulant program was applied to Pinot Noir wine grapes
Richard Hall, 27 March 2020
Crops
Variety
Pinot Noir MV6
Location
Mornington Peninsula
Study date
October 2019 - March 2020
Source
2019-10-WG-PN-MP-2
Sample
3,688 berries
Products
Objectives
- Improve yield
Timings
- Pre-flowering
- Flowering
- Veraison
Summary
- +28% bunch weight
- +25% berries per bunch
- +2% berry density
Seasonal yield variability is a significant problem for grape growers. Poor yields are often a result of adverse environmental conditions during critical growth stages impacting fruit set and ripening.
Biostimulants are increasingly being applied in viticulture to mitigate the impacts of adverse environmental conditions and lessen vineyard variability. With less vineyard variability, our jobs are easier and more effective which is rewarded with improvements in both yield and quality.
During the 2019-20 growing season, a trial was conducted on the Mornington Peninsula to measure the impact of a biostimulant program on the yield of Pinot Noir.
Significant increases were reported in:
- Fruit set +25% (p = 0.007)
- Bunch weight +28% (p = 0.008)
- Berry Density Index +2% (p = 0.046)
Increases in fruit set are self-explanatory, we want to optimise fruit set for the given season.
The increase in bunch weight is greater than the increase in fruit set.
This additional increase in bunch weight is due to increased berry density - berry weight increases more than berry size / volume.
Although chemistry analysis was not conducted on these samples, other trials show increased concentrations of primary and secondary metabolites. It is likely that retained acid is largely responsible for the increased berry density. As we reduce heat stress and improve ripening precision, improved acid retention is one expected outcome.
It is recommended to include tank-mixes of the foliar sprays FOLICIST / NUTRI-GEMMA B Zn to promote fruit set and SUNRED / FOLICIST to promote ripening performance.
Refer to the BUD Biological Wine Grape Program for more information.
Materials and Methods
Trial design and treatments
A randomised controlled trial was conducted in a Pinot Noir block on the Mornington Peninsula, commencing October 2019 to harvest in March 2020.
Standard - grower standard spray applications
Treated - per table below, five foliar spray applications were made with a knapsack sprayer in addition to the grower standard program.
Standard
Timing
Growing season
Foliar
Grower standard program
Treated
Timing
Bunches 3-4 cm long
Foliar
FOLICIST® 1 L/ha
NUTRI-GEMMA B-Zn 1.5 L/ha
Timing
Pre-flowering
Foliar
FOLICIST® 1 L/ha
NUTRI-GEMMA B-Zn 1.5 L/ha
Timing
Flowering
Foliar
FOLICIST® 1 L/ha
Timing
Veraison
Sample size and measurements
- Sample size = 3,688 individual berries from 32 bunches
- Fruit set = number of berries per bunch
- Bunch weight (g)
- Berry weight (g)
- Berry cross-sectional area (mm^2)
- Berry Density Index = berry weight (g) / berry cross-sectional area (mm^2)
AgIntelligent® Imaging
We use the AgIntelligent® Imaging system to measure berry cross-sectional area, an example in Image 1 below.
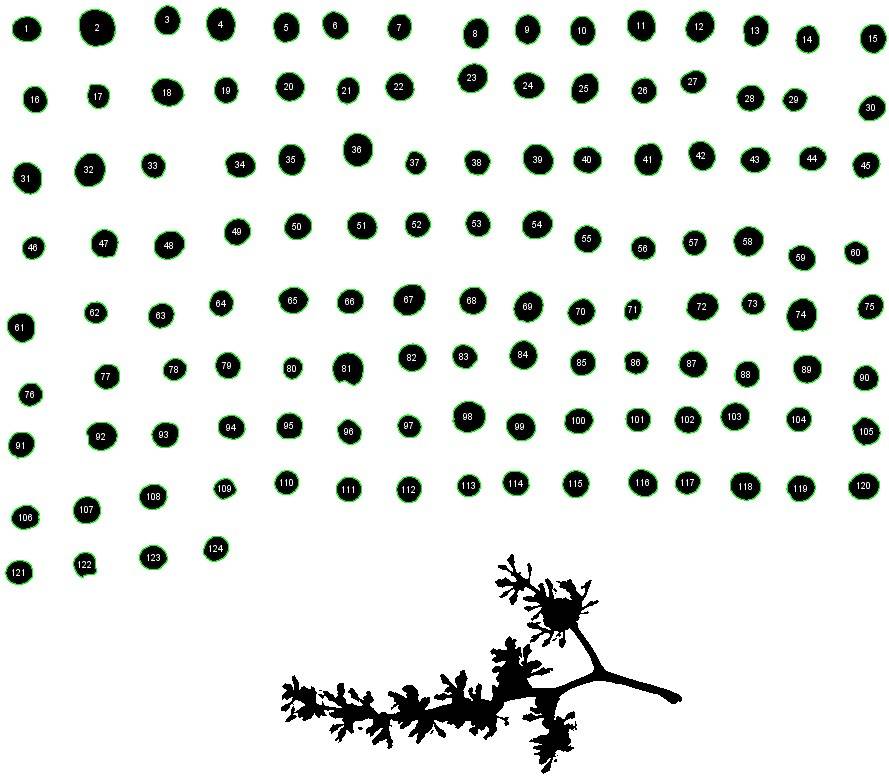
Image 1 Example of AgIntelligent® Imaging used to measure berry cross-sectional area. Each of 3,688 berries in this trial have a unique ID which also corresponds to individual berry weight data to calculate Berry Density Index.
Results and Discussion
Results - bunch weight
As shown in Figure 1 and Table 1, bunch weight is significantly (p = 0.008) increased from Standard bunches 48g to Treated bunches 62g, an increase of +28%.
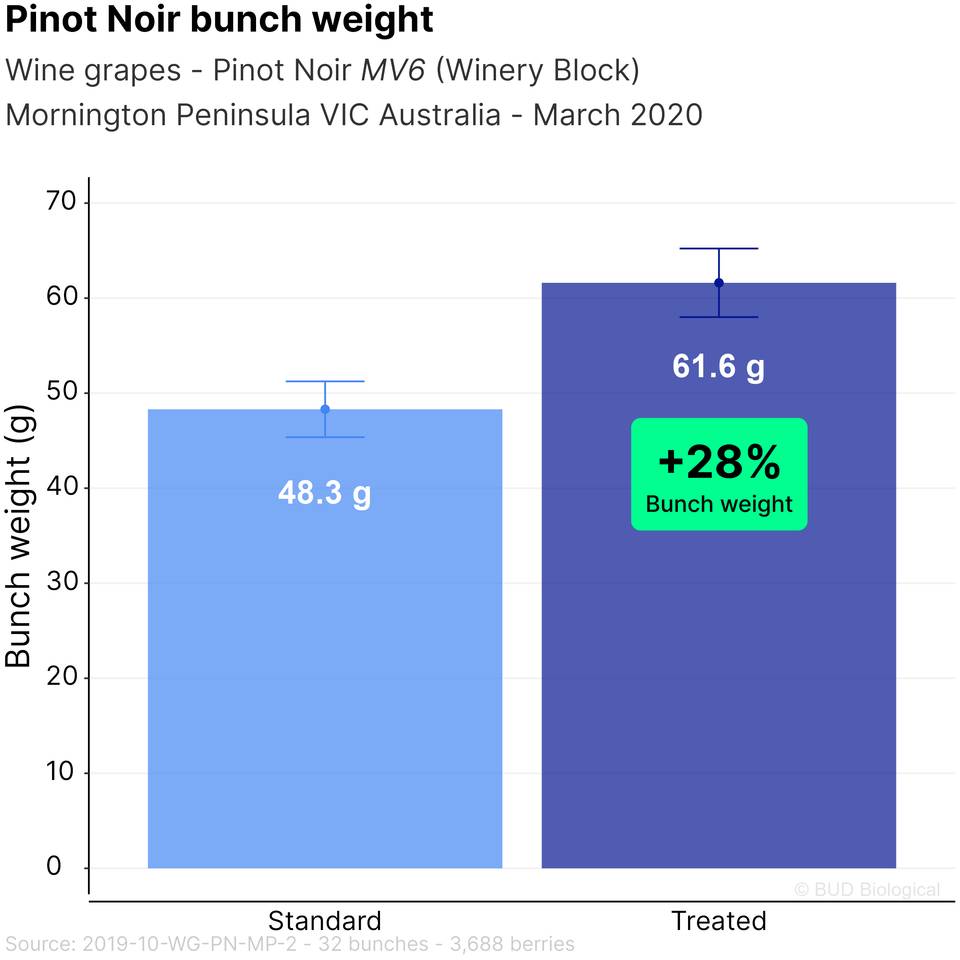
Figure 1 Biostimulant Treated Pinot Noir bunches were significantly heavier +28% than Standard bunches (p = 0.008).
Berries per bunch is significantly (p = 0.007) increased from Standard bunches 102 berries to Treated bunches 128 berries, an increase of +25%.
There is no significant difference in rachis weight.
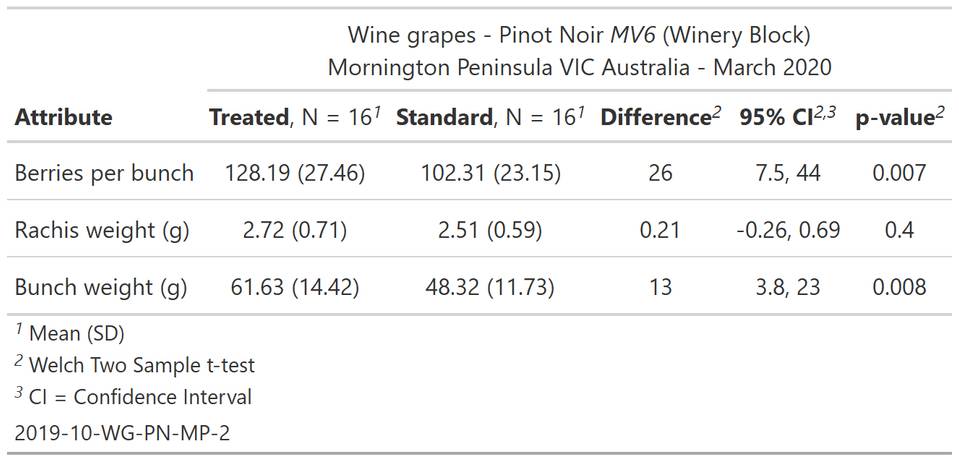
Table 1 At harvest, biostimulant Treated vines had a significantly (p = 0.007) higher number of berries per bunch (+25%) and significantly (p = 0.008) higher bunch weight (+28%). There is no significant difference in rachis weight. N = 32 bunches; 3,688 berries
Treated vines had significantly more berries per bunch. Figure 2 below shows us that even bunches with the same number of berries were heavier in the Treated vines.
This treatment difference increases as the number of berries increases. This is consistent with other trials and can be attributed to improving the ripening performance of the vines with veraison sprays of a SUNRED / FOLICIST tank-mix.
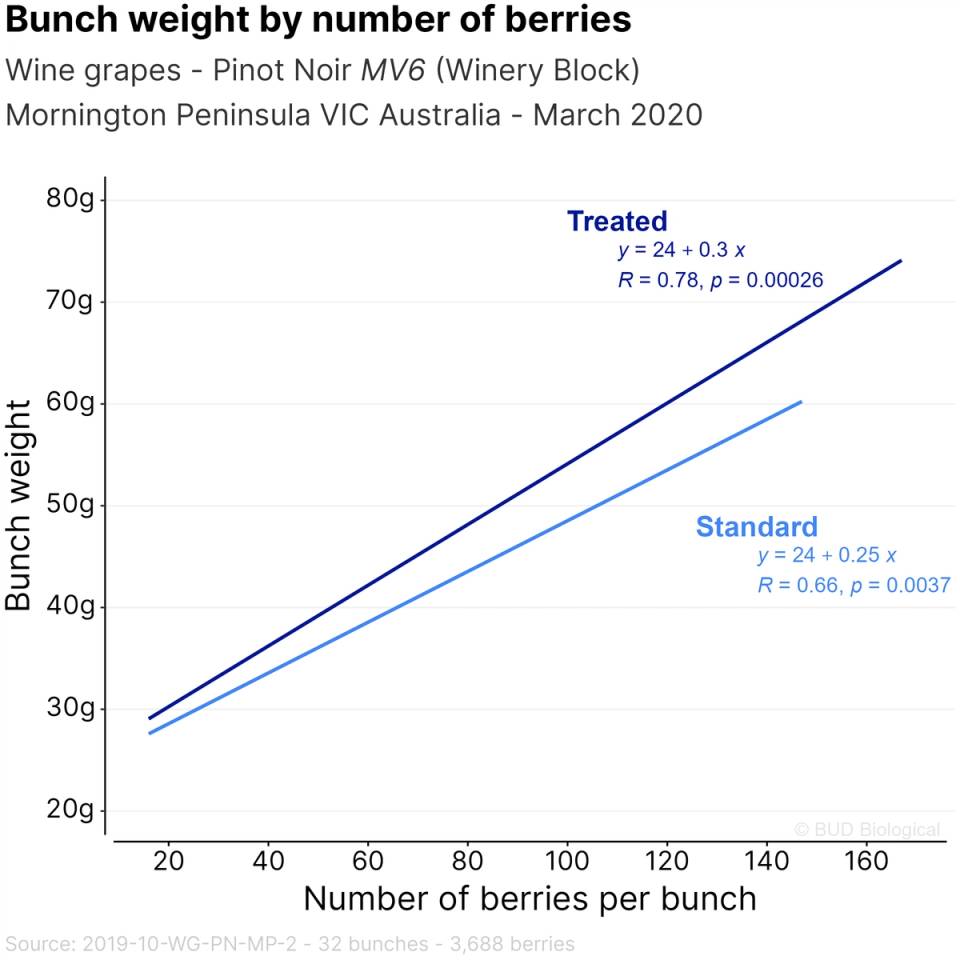
Figure 2 Bunch weight (g) by number of berries per bunch. As the number of berries per bunch increases, Treated bunch weight increases at a greater rate than Standard bunch weight.
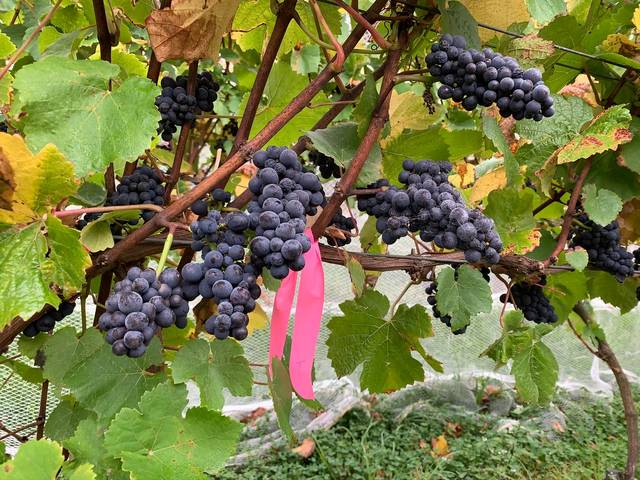
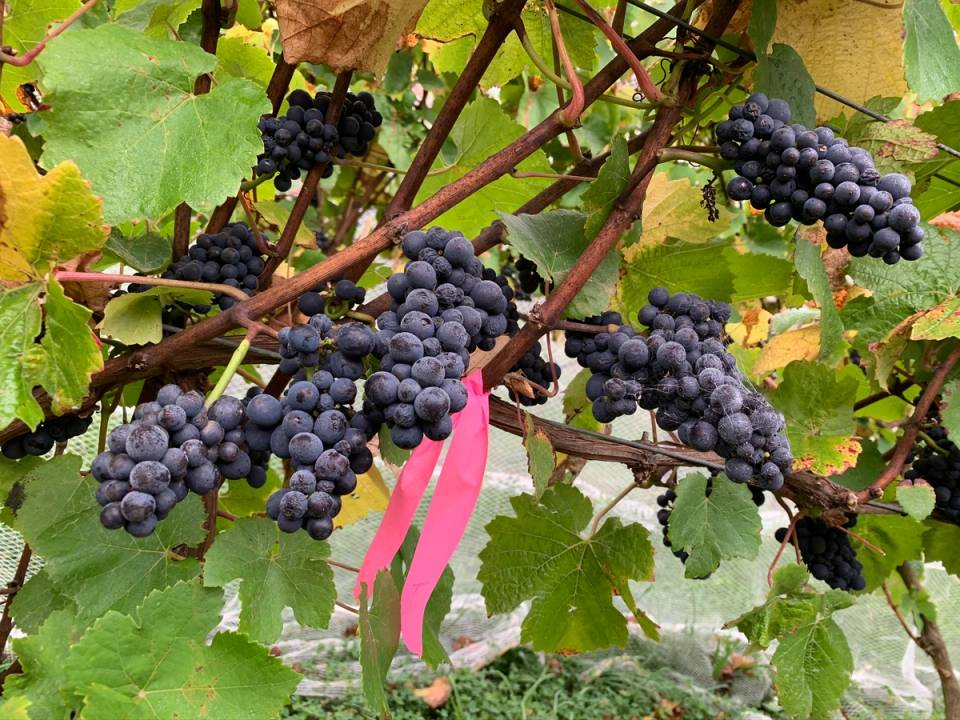
Photos 1 and 2 below are typical of bunches across the Treated and Standard plots. Note consistency of berry set of the Treated bunches in Photo 1 compared to the coulure or "misses" in berry set in the Standard bunches.
On average across the trial, the Standard bunches were missing 26 berries per bunch (-28% bunch weight) compared to the Treated bunches.
Photo 1 Pinot Noir bunches typical of the biostimulant Treated vines, on average 28% heavier bunches (p = 0.008) than Standard vines.
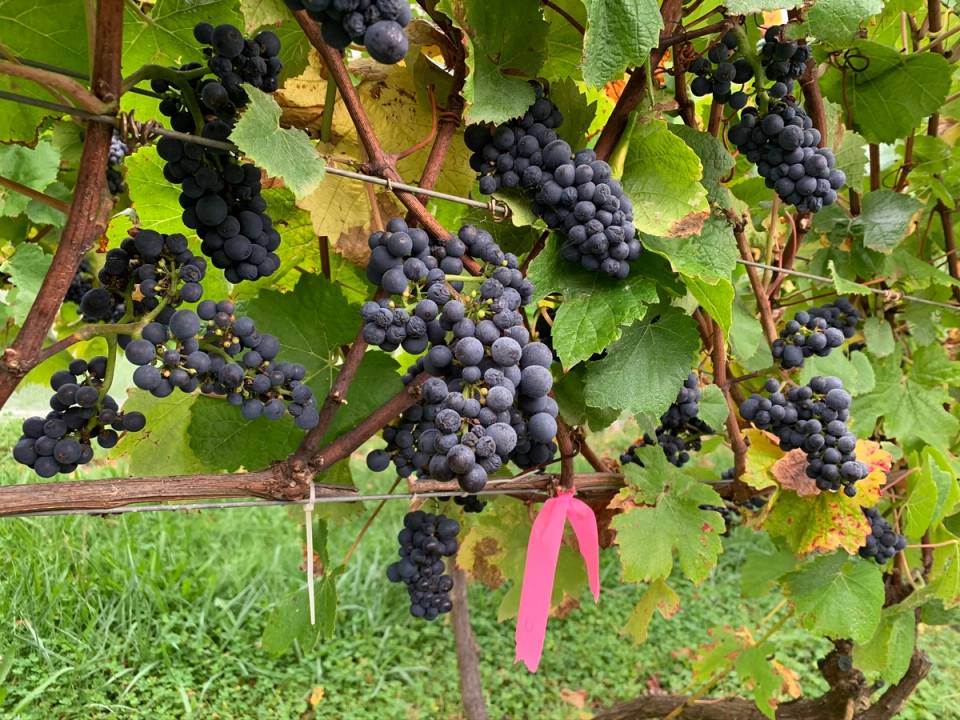
Photo 2 Pinot Noir bunches typical of the grower Standard vines, coulure on average missing 26 berries per bunch and -28% weight.
Results - berry weight
Whilst we see a significant increase in bunch weight / yield, there is no significant difference in berry weight.
The yield density plot in Figure 3 shows the improved uniformity in average berry weight per bunch of the Treated vines.
With more consistent fruit set we see less variability in average berry weight between bunches.
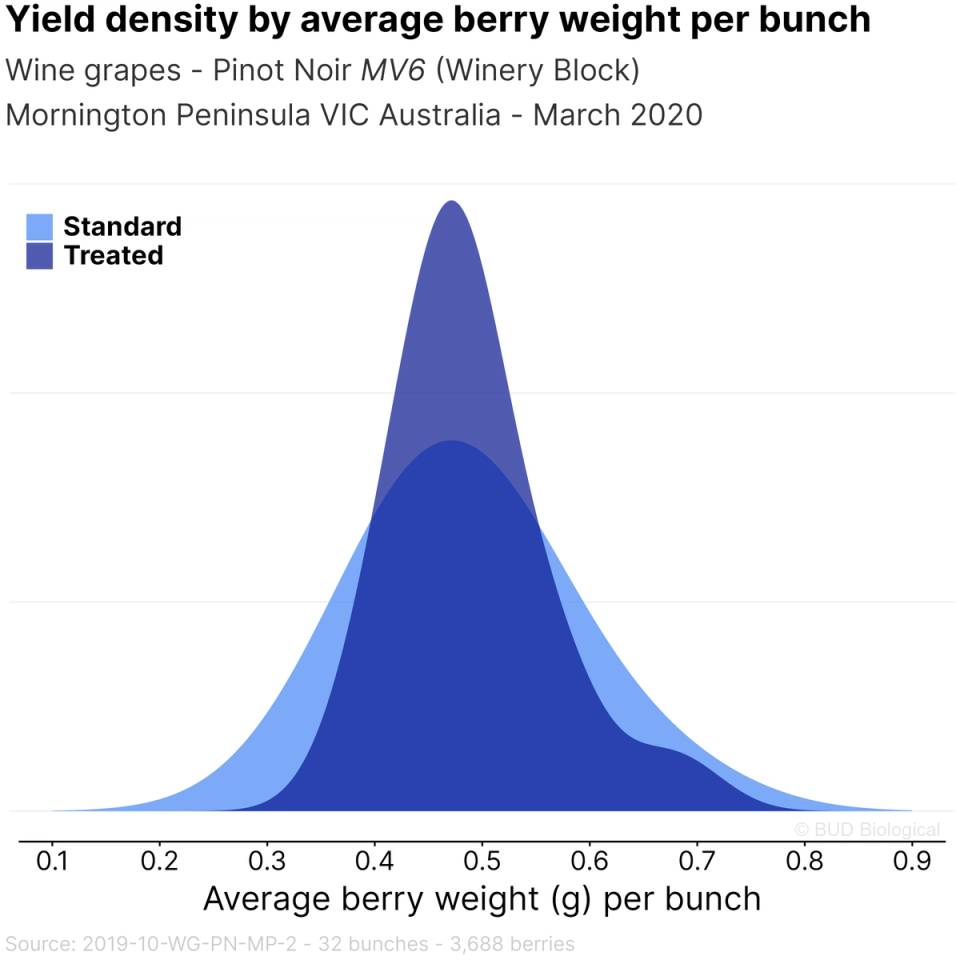
Figure 3 Average berry weight per bunch is more uniform in the biostimulant Treated vines. Improved uniformity (less variability) is a core concept in biostimulant programs and this uniformity / consistency is a driver of quality and yield.
Table 2 summarises measurements of 3,688 berries. Treated berries have a significantly (p = 0.046) higher Berry Density Index. There is no significant difference in berry "size" as measured by either berry weight or berry cross-sectional (berry c-s) area.
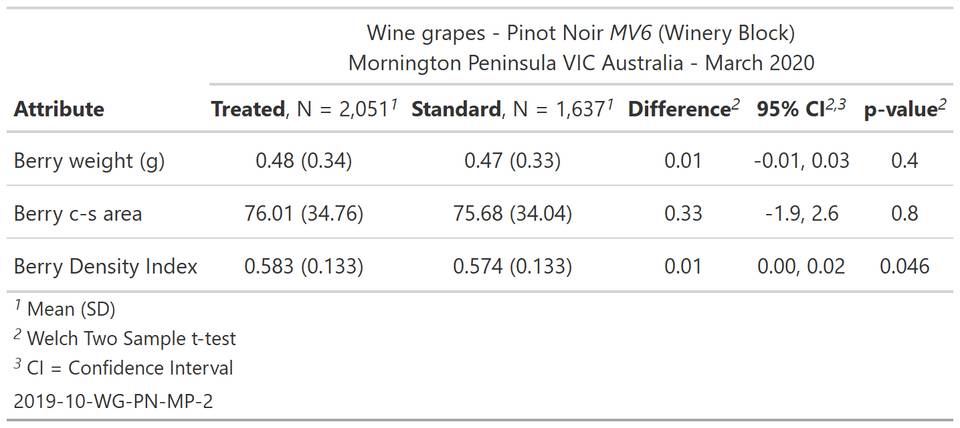
Table 2 At harvest, biostimulant Treated vines had significantly (p = 0.046) higher Berry Density Index. Berry "size" measured as either weight or cross-sectional area was not significantly different.
Figure 4 summarises statistics related to berry weight. Note the binomial distribution of berry weight due to hen (larger) and chicken (smaller) / millerandage which was particularly characteristic for the 2020 vintage on the Mornington Peninsula.

Figure 4 Individual berry weight of 3,688 berries across both Treated and Standard bunches, each dot represents a berry. Note the binomial distribution of hen (larger) and chicken (smaller) berries. No significant difference exists in berry weight between Treated and Standard bunches.
Acknowledgemenets
Thank you to the grower for access to the vineyard and their interest in this work.
Related Resources
FOLICIST®
Promote flowering, fruit set and crop uniformity
Biostimulant
Organic Farming
NUTRI-GEMMA B-Zn
Boron (B) and zinc (Zn) enriched with glycine betaine to promote shoot and flowering uniformity
Fertiliser Biostimulant
Organic Farming
SUNRED®
Biostimulant of optimal fruit ripening and colour
Biostimulant